Smoking Cessation Success Rate Analysis Graph – Effectively Visualized Data
RL0100086_3
- Last Update 01/23/2025
- File Size 2MB
- # of Slides 2
- File Format PPTX
- Slide Ratio 4:3
- Color
Keywords
About the Product
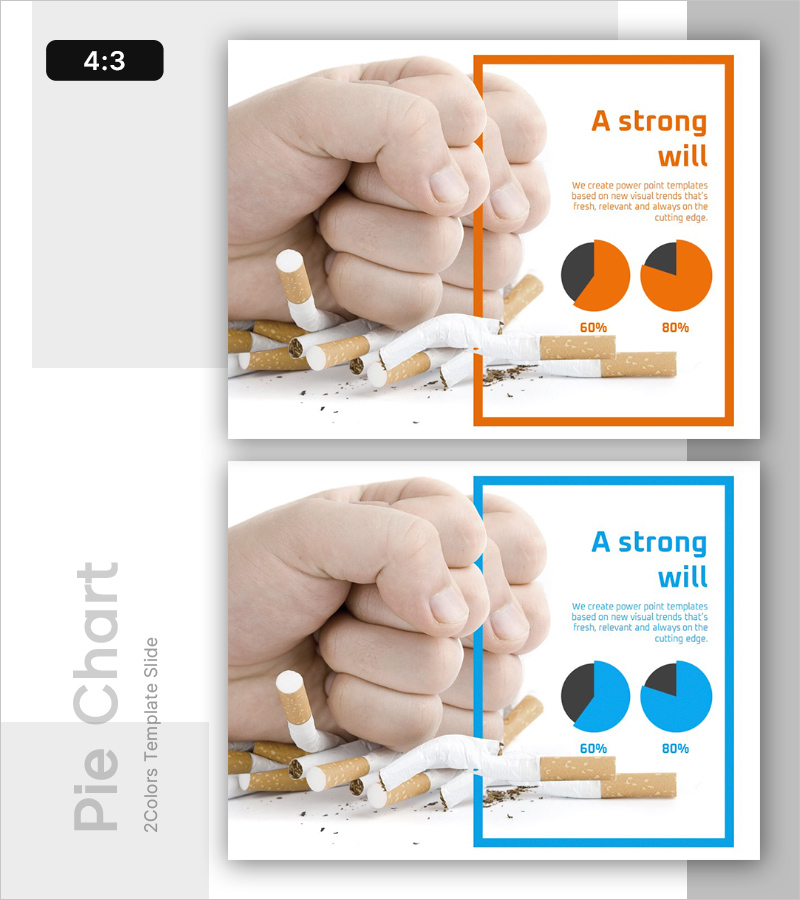
A 2-slide PowerPoint presentation visualizing smoking cessation success rates with two color scheme options: orange and blue. Each slide features two pie charts displaying 60% and 80% data side-by-side for clear comparison. The left side showcases a powerful image of a fist crushing cigarettes, symbolizing the determination to quit smoking, while the right side presents statistical data framed in either orange or blue borders. This layout effectively communicates success metrics and is ready to integrate into presentations on growth, overcoming challenges, or health initiatives. Editable PPTX format allows quick customization without design expertise.
Usage Points
-
Main Usage
This slide effectively communicates smoking cessation program effectiveness by comparing two success rate metrics (60% and 80%) through pie chart visualization. It transforms raw data into an intuitive visual format, making it ideal for healthcare presentations, wellness program reports, and public health campaigns where credibility and clarity are essential.
-
How to Use
Double-click the pie chart values to edit them with your own data. Select either the orange or blue version based on your presentation theme and brand colors. Customize the title and descriptive text to match your specific message. The slide supports various data comparisons: year-over-year improvements, program-specific outcomes, demographic breakdowns, or regional performance metrics.
-
Recommended For
Healthcare professionals, medical institution marketing teams, wellness program coordinators, public health officials, corporate health and safety managers, government policy presenters, and non-profit organizations focused on smoking cessation campaigns and health promotion initiatives.
-
Slide Structure
2-slide layout with each slide divided into two sections: left side contains a visual element (fist crushing cigarettes image), right side includes a title text area, two pie charts, and percentage labels. The 4:3 aspect ratio ensures compatibility with standard presentation systems. Each chart is independently editable, allowing flexible data updates without affecting the overall design.


