Visual Trend Diagram Slide – Creativity and Connection
RJ0800037_13
- Last Update 08/10/2025
- File Size 0.1MB
- # of Slides 2
- File Format PPTX
- Slide Ratio 16:9
- Color
Keywords
About the Product
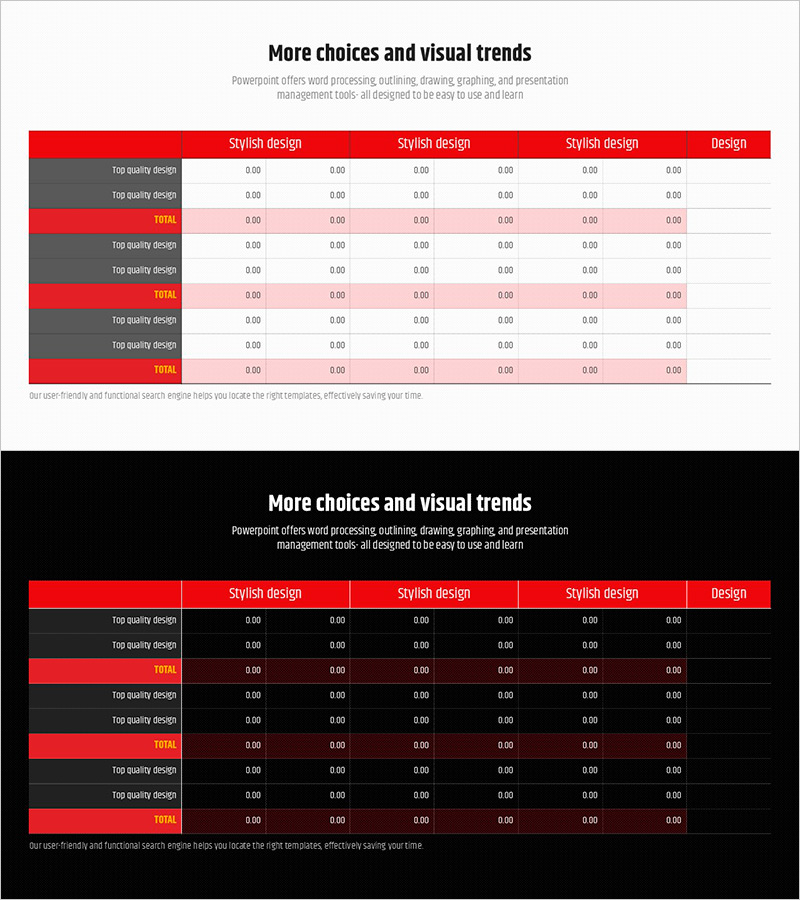
A table diagram PowerPoint slide designed for systematic comparison and analysis in presentations. This 2-slide deck features red, gray, and pink header and data cells, optimized for quality assessment, performance metrics, and item-by-item numerical comparison. Available in 16:9 widescreen PPTX format, fully editable and ready to use in reports, presentations, and analytical materials to communicate key data clearly.
Usage Points
-
Main Usage
A table diagram that expresses both quantitative data and qualitative evaluation simultaneously, systematically comparing characteristics, performance, and quality across multiple items in rows and columns. Ideal for organizing complex information in reports, analytical materials, and proposals for quick comprehension.
-
How to Use
Slide 1 consists of a header row (red) and data rows (gray and pink alternating), with editable cells for text, numbers, and evaluation symbols. Slide 2 uses the same structure for additional datasets. Colors, cell sizes, and fonts can be freely modified using standard PowerPoint tools.
-
Recommended For
Effective for executives, analysts, and project managers presenting performance evaluations, quality comparisons, and market analysis. Particularly suited for multi-criteria assessment, benchmarking, product specification comparison, and team performance analysis where quantitative evidence is essential.
-
Slide Structure
2-slide deck. Each slide features a 6-column table layout with 1 header row (red background, white text) and 3-4 data rows (alternating gray and pink backgrounds). Optimized for 16:9 widescreen ratio with all cells as fully editable text boxes.
Related Products
-

Typographic Wide Template Flow Diagram – Innovative Business Strategy
#Business Strategy #Technical Approach #Diagram
-

Dot Patterns Wide PowerPoint Template – Product and Program Introduction
#Product/Service Introduction #Diagram #Features
-

Fantastic Wide PPT Sequence Diagram – Business Strategy Direction
#Business Strategy #Diagram #Business Direction
-

Trend Color Wide Template Image&Text1 – Product/Service Introduction
#Product/Service Introduction #Diagram #Product/Service Introduction
