Slide Visualizing Truthfulness with Lie Detector
RL0100083_3
- Last Update 10/23/2025
- File Size 1.3MB
- # of Slides 2
- File Format PPTX
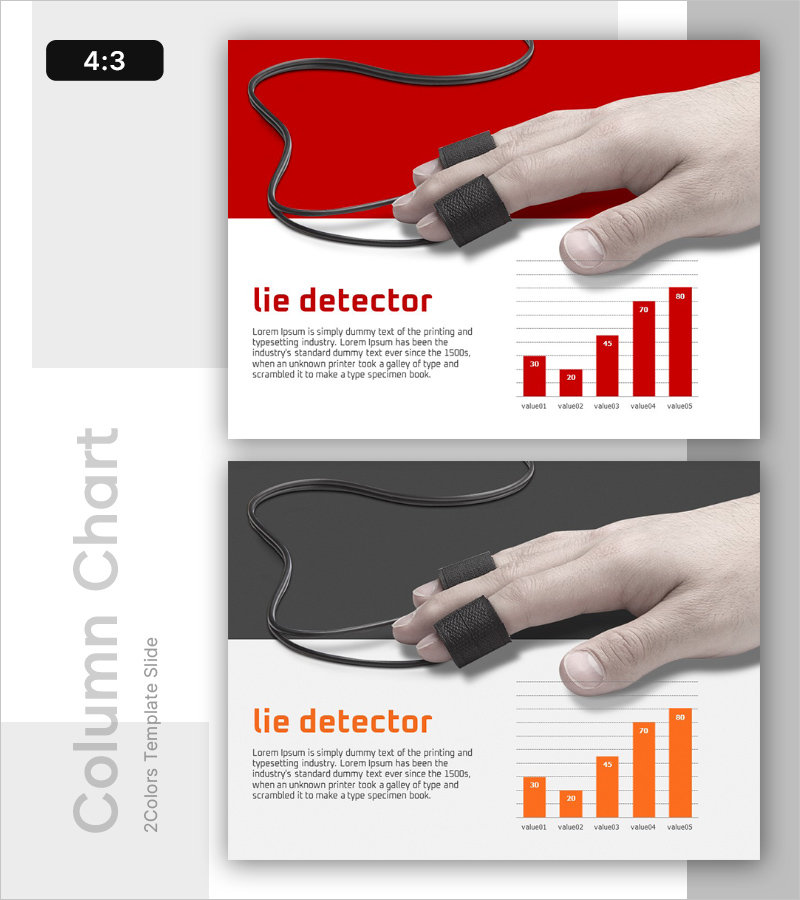
- Slide Ratio 4:3
- Color
Keywords
About the Product
A data visualization PowerPoint slide combining a lie detector device image with a bar chart showing five-level numerical data. Available in red and gray color versions, this slide presents sensor technology and comparative metrics in a single layout. Ideal for presentations on credibility verification, risk assessment, and truthfulness evaluation in conflict and risk management contexts. Formatted as 4:3 PPTX with 2 slides, featuring clearly separated text and chart areas for easy editing and customization.
Usage Points
-
Main Usage
Visually communicate lie detector data to demonstrate credibility verification, risk assessment, and truthfulness evaluation results. The combination of finger sensor device imagery and five-level numerical data simultaneously conveys technical reliability and data integrity, strengthening audience confidence in verification outcomes.
-
How to Use
Use in conflict and risk management presentations, credibility verification reports, security system explanations, and legal evidence presentations. Select the red version to emphasize urgency and risk, or the gray version to convey objectivity and neutrality based on your presentation context and audience expectations.
-
Recommended For
Legal teams, security officers, risk management professionals, surveillance system managers, and credibility verification departments. Particularly suited for B2B pitches, internal reports, and regulatory agency briefings where technical reliability and data integrity must be emphasized.
-
Slide Structure
Layout divides the slide into three sections: lie detector finger sensor image on the left (approximately 40%), title and descriptive text on the upper right (approximately 30%), and five-level bar chart on the lower right (approximately 30%). Two text input areas and one chart area provide clear information hierarchy, optimized for 4:3 aspect ratio.
Related Products
-

Work Stress Theme Template Ending Cover
#Emotional Messages
-

The Suffering of the Victims of School Violence – Emotion and Necessity in Strategy
#Business Vision and Strategy #Emotional Messages #Business Background and Necessity
-

Messages for Instant Food - Tales of Greed and Crisis
#Emotional Messages
-

A Poor Day – Visualization of Danger and Anxiety
#Emotional Messages
