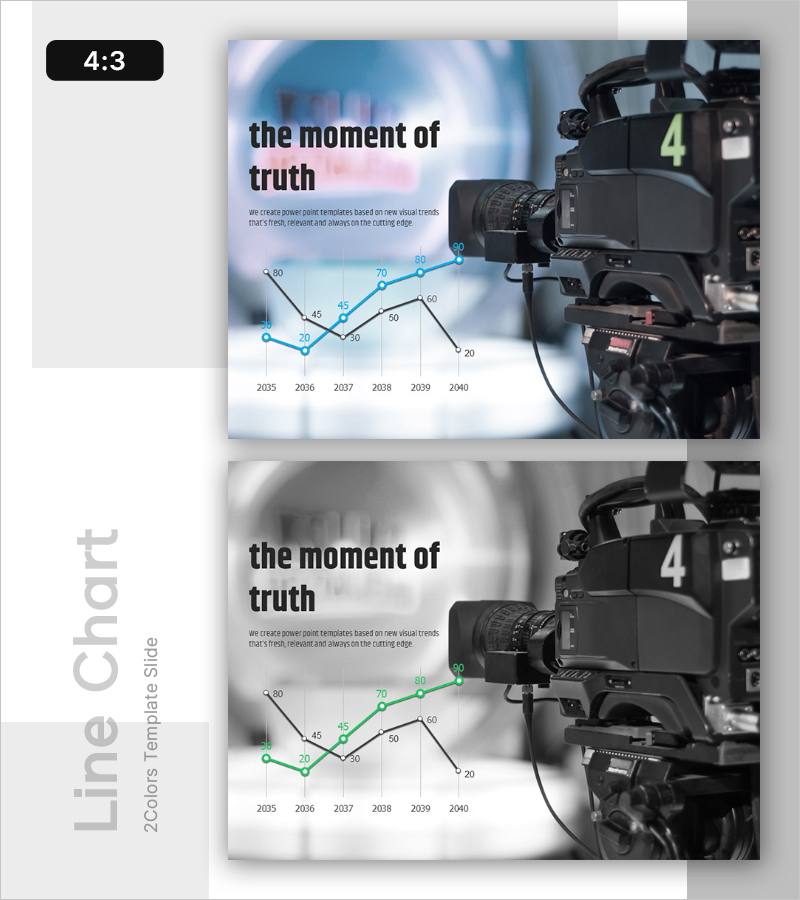
Broken Line Comparison Analysis Graph – Visualizing Market Competitiveness
RL0100082_3
- Last Update 01/23/2025
- File Size 1.5MB
- # of Slides 2
- File Format PPTX
- Slide Ratio 4:3
- Color
Keywords
About the Product
A PowerPoint slide featuring dual-line comparison analysis for visualizing market competitiveness and competitive positioning. This slide displays two data series simultaneously using overlapping line graphs with distinct blue and gray tones, making it ideal for competitor analysis, market trend comparison, and performance tracking. Each data point is labeled with numerical values for clarity and precision. Perfect for business presentations, annual reports, and investor pitches where you need to demonstrate competitive advantage through data-driven insights.
Usage Points
-
Main Usage
Compare two data series over time—such as competitor revenue, market share, or growth rates—using a dual-line graph with labeled data points. This slide enables objective, data-driven comparison of competitive positioning and market dynamics.
-
How to Use
Insert into business reports, executive briefings, investor presentations, or strategy meetings during the competitive analysis section. Simply update the year labels and numerical values, then adjust line colors to match your brand palette for immediate use.
-
Recommended For
Executives, marketing teams, sales professionals, and strategic planners presenting competitive analysis and market positioning. Particularly valuable when communicating market standing and competitive advantages to investors, partners, and stakeholders.
-
Slide Structure
Title area + descriptive text + dual-line graph with data points labeled from 2035 to 2040 + legend. Left-aligned text and right-aligned graph create balanced information hierarchy, combining narrative context with visual impact.


