Components of a Container Doughnut Chart – Market Share Analysis
RL0100080_3
- Last Update 01/22/2025
- File Size 1.7MB
- # of Slides 2
- File Format PPTX
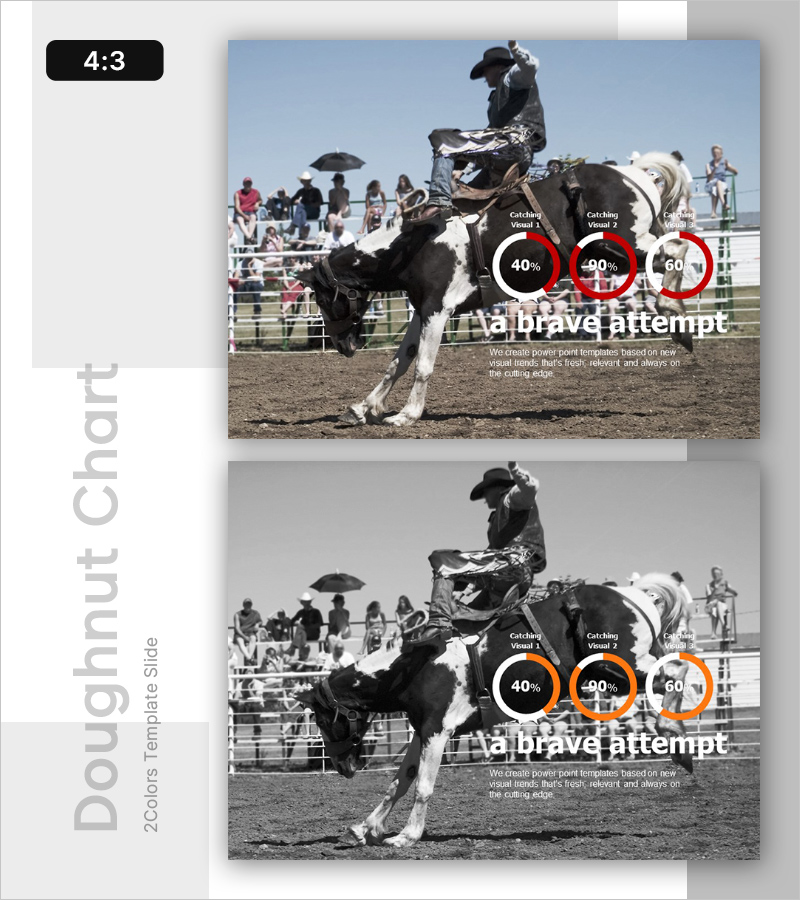
- Slide Ratio 4:3
- Color
Keywords
About the Product
This slide features a doughnut chart designed to visually analyze market share. The prominent colors, red and orange, emphasize the importance of the data visually. This template is crafted to visually represent results from various market and competitive analyses, making it ideal for business meetings, investment presentations, and strategic seminars. Text and data fields are easily replaceable, with a medium editing difficulty to ensure convenience.
Usage Points
-
Main Usage
- This template is particularly useful for business professionals looking to present market share insights during board meetings or strategic planning sessions. It allows for a clear visual representation that aids in decision-making processes related to market positioning and competitive analysis.
-
How to Use
- Utilize this template during presentations where data-driven insights are essential, such as investor pitches or team briefings. It provides a framework for integrating textual explanations with visual data to enhance understanding and engagement among stakeholders.
-
Recommended For
- Ideal for marketing analysts, business strategists, and project managers who need to communicate complex data in a straightforward manner. This template is suited for those preparing presentations that require a blend of analytical rigor and visual appeal to effectively convey market dynamics.
-
Slide Structure
- The overall structure of the slides is designed to guide the audience through key findings, starting with an overview of market trends, followed by detailed analyses of competitors, and culminating in strategic recommendations based on the data presented. Each section is visually distinct to facilitate comprehension.
Related Products
-

Life Template Ending Cover for Seniors
#Emotional Messages
-

Segmented Bar Graph – Market and Competitor Analysis
#Emotional Messages
-

Business Growth Analysis Graph – Market Outlook and Growth Potential
#Emotional Messages
-

Potential Template Cover – A Professional and Emotional Start
#Emotional Messages
