Happiness Index Analysis Graph – Competitive Market Analysis
RL0100077_4
- Last Update 01/22/2025
- File Size 3.7MB
- # of Slides 2
- File Format PPTX
- Slide Ratio 4:3
- Color
Keywords
About the Product
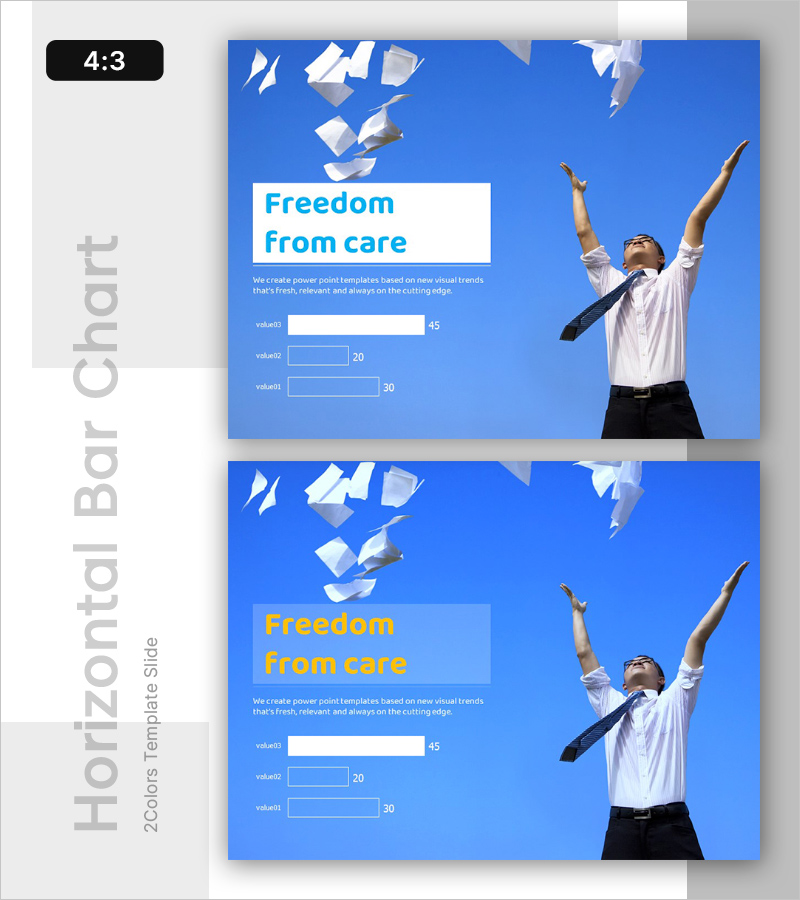
A horizontal bar chart PowerPoint slide that visualizes emotional states and freedom levels. Designed with a bright blue background, white text boxes, and three data bars representing comparative values, complemented by an uplifting human figure image on the right side. Provided as a 2-slide PPTX deck in 4:3 aspect ratio, ready for immediate use in corporate presentations, sentiment analysis reports, and wellness-related slideshows. Clear text and numeric input areas enable quick data updates without design modifications.
Usage Points
-
Main Usage
Quantifies and compares emotional metrics such as sentiment state, freedom level, and satisfaction scores. Ideal for corporate wellness program evaluations, employee satisfaction surveys, and research presentations on emotional analysis and well-being metrics.
-
How to Use
Enter numeric values into the three horizontal bar fields on the blue background, and the chart automatically scales proportionally. Modify the title and descriptive text to match your presentation context, and adjust colors as needed using PowerPoint's built-in formatting tools.
-
Recommended For
HR and organizational development teams presenting employee satisfaction results, marketing teams sharing customer sentiment analysis, research institutions presenting psychology and wellness studies, and consulting firms delivering organizational diagnostic findings.
-
Slide Structure
2-slide deck: Slide 1 features a title area (Freedom from care) with descriptive text and three horizontal bars (value01–03 with data points 45, 20, 30). Slide 2 mirrors the layout with a yellow title variant. Each slide contains 4 text input zones and 3 data bar elements for flexible customization.
Related Products
-

Vibrant Intro Slide for Generation Z
#Emotional Messages
-

Thoughtful Time Template – Creative Ending Cover
#Emotional Messages
-

Presentation Slide for Valuable Consumer Goods Introduction and Diagram
#Emotional Messages
-

Automotive Product Introduction – Personalization and Innovation
#Emotional Messages
