Free Circular Emphasis Figure Donut Chart – Effective Data Presentation
RJ0800019_5
- Last Update 08/05/2025
- File Size 3.6MB
- # of Slides 2
- File Format PPTX
- Slide Ratio 16:9
- Color
Keywords
About the Product
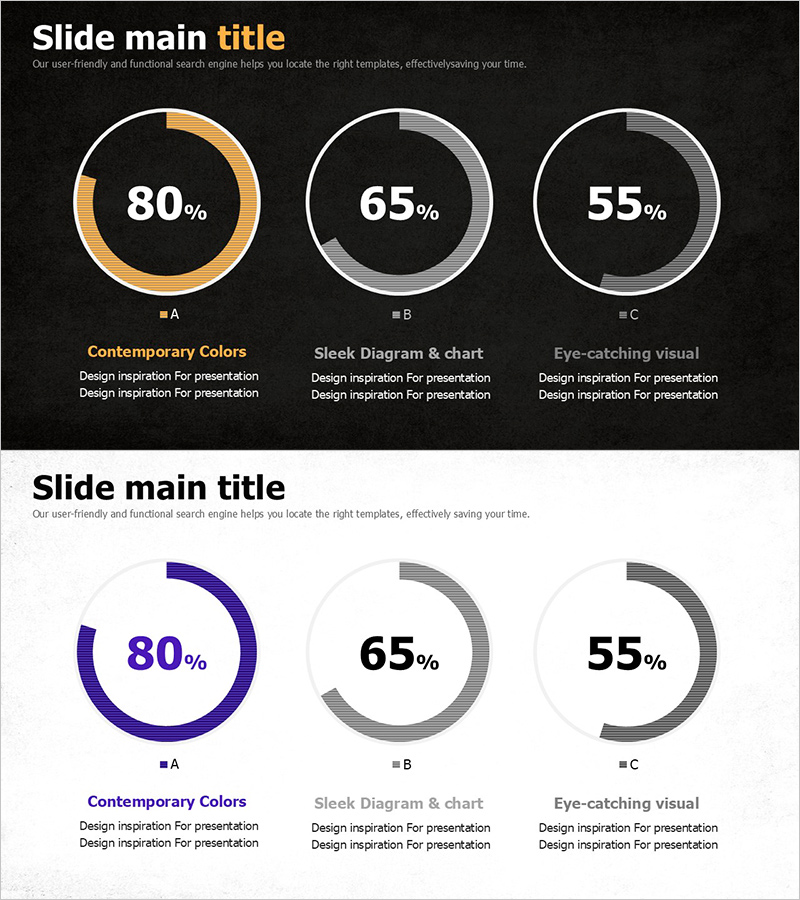
This free PowerPoint slide features three donut charts arranged side by side, making it easy to compare key figures across three categories at a glance. Two color themes are included on a single slide: a dark version with a black background and gold/gray ring accents, and a light version with a soft gray background and purple/gray ring accents. Each donut chart displays a large percentage figure at the center, with space below for a category label, subtitle, and two lines of description text. The three-column horizontal layout keeps the presentation clean and easy to read, whether you are presenting a performance report, marketing plan, or business proposal. Simply replace the numbers and text with your own data to complete the slide. No advanced PowerPoint skills are required. For more donut chart and circular graph slides, explore the free graph section at GoodPello.
Usage Points
-
Main Usage
Designed to visually compare three key metrics — such as achievement rates, market share, or progress percentages — using donut-style circular charts, making data immediately clear to any audience in business presentations.
-
How to Use
Choose between the dark theme (black background with gold rings) or the light theme (soft gray background with purple rings) to match your presentation style, then replace each chart's percentage, label, subtitle, and description text with your actual data.
-
Recommended For
Best suited for marketers, business planners, startup teams, and executives who need to present three numerical KPIs or performance indicators on a single, visually impactful slide without spending time on custom design.
-
Slide Structure
Single-slide layout with 3 donut charts arranged horizontally, each containing a large center percentage, category label, subtitle, and 2-line description field. Includes both dark and light color themes on one slide.
Related Products
-

Unique Fashion Models and Texts for Business Strategy Presentation – Style and Innovation
#Business Strategy #Operational Plan #Mitigation Measures
-

Introducing Blue Leather Bags – Stylish Design
#Product/Service Introduction #Benefits and Advantages
-

Fashion Product Quality Guarantee Plan Infographic
#Business Vision and Strategy #Business Management #Diagram
-

3 Product Categories Slide – Stylish Design
#Product/Service Introduction #Diagram #Program Introduction
