Casualty Ratio Graph About the Dangers of Cigarettes
RJ0800019_12
- Last Update 08/04/2025
- File Size 6.8MB
- # of Slides 2
- File Format PPTX
- Slide Ratio 16:9
- Color
Keywords
About the Product
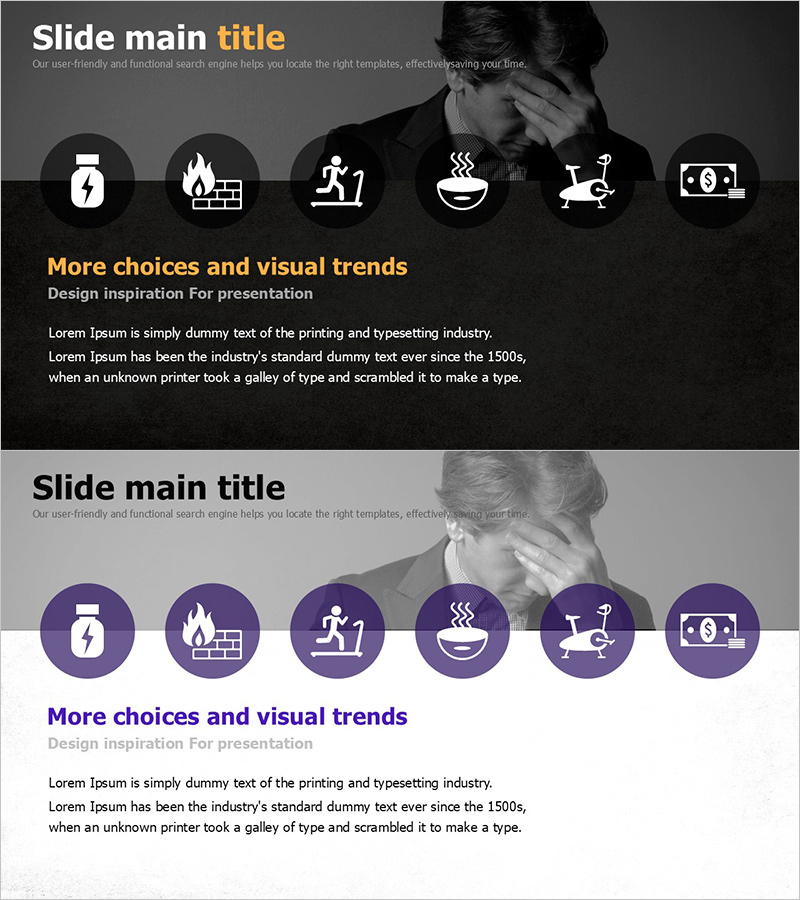
A 2-slide PowerPoint presentation visualizing cigarette dangers and casualty ratios with data-driven design. The slides feature a dark gray background with white icons and gold accent colors, displaying six circular icons (energy, fire, exercise, food, exercise equipment, finance) alongside key messaging. These presentation slides provide clear data visualization for risk management, compliance reporting, and case study presentations, with distinct text input areas and chart spaces for immediate editing. Delivered in 16:9 widescreen PPTX format, suitable for corporate reports, government documentation, and educational materials.
Usage Points
-
Main Usage
Clearly visualizes cigarette-related risk data and casualty ratios to enhance audience understanding. Circular icons and charts translate complex statistical information into intuitive visuals, optimized for risk management, compliance, and case analysis presentations.
-
How to Use
Input cigarette risk data, accident statistics, and compliance information into the slide text areas, then add ratio data to the chart sections. Use in corporate safety training, government reports, insurance presentations, and healthcare facility briefings to emphasize risk factors.
-
Recommended For
Recommended for corporate safety officers, health educators, government agencies, insurance companies, healthcare institutions, and compliance departments presenting risk data. Particularly effective for risk management policies, compliance training, and case analysis presentations.
-
Slide Structure
2-slide layout with the first slide featuring title, subtitle, and six circular icon placements, and the second slide containing 'More choices and visual trends' section with separated text explanation and chart areas. Optimized for 16:9 widescreen format.
Related Products
-

Inmate Background and Text Box - Risk Management Case Study
#Slide Type #Risk Management and Regulatory Compliance # Risk Management Strategy
-

Construction Site Text Box – Risk Management and Compliance
#Slide Type #Risk Management and Regulatory Compliance #Diagram
-

Hamburger Illustrations and Columns – Ideal Slide for Business Vision Strategy
#Slide Type #Business Vision and Strategy #Business Background and Necessity
-

Aurora Camping Tent Photos – Mysteries of the Night Sky
#Slide Type #Outro #Reference
