Exercise Icons and Maps for Market Analysis Slide
RJ0800015_9
- Last Update 08/04/2025
- File Size 1.1MB
- # of Slides 2
- File Format PPTX
- Slide Ratio 16:9
- Color
Keywords
About the Product
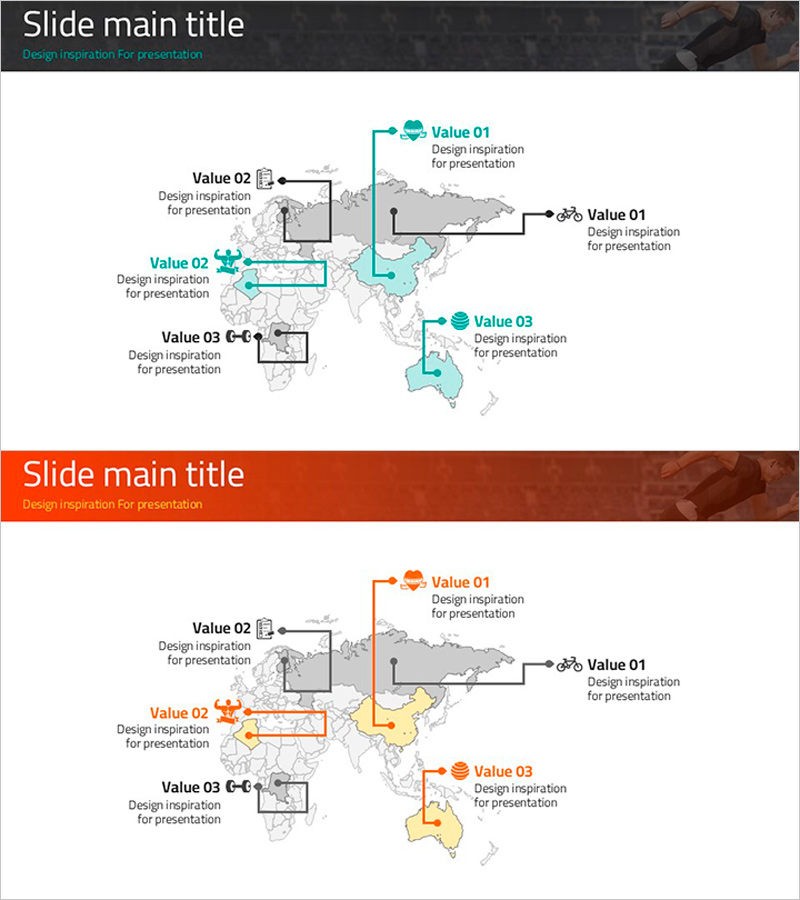
A PowerPoint slide featuring a world map background with five key regions (Asia, Europe, Africa, Australia, North America) connected by exercise icons and connector lines. Available in two color versions—teal and orange—to visualize competitive analysis, market entry strategies, and global network structures. Each region includes editable Value labels for data input. The 2-slide deck in 16:9 widescreen format allows full customization of shapes, icons, and text. Perfect for business presentations, marketing strategy decks, and global expansion reports.
Usage Points
-
Main Usage
Visualize global market conditions, competitive landscape, and regional expansion strategies on a world map at a glance. Position icons and labels across regions to illustrate international business networks, supply chains, and partnership structures with intuitive geographic context.
-
How to Use
Click the 'Value 01–03' labels to input region names, metrics, and descriptions. Freely adjust icon colors, sizes, positions, and connector line styles. Select the teal version to emphasize stability and trust, or the orange version to highlight growth and activity.
-
Recommended For
Executive presentations on global market analysis, international expansion strategy reports, cross-border business partnership proposals, and multinational performance reviews by marketing teams, strategy planners, and C-suite executives.
-
Slide Structure
2-slide deck with world map background. Each slide highlights five regions with exercise icons, connector lines, and editable Value labels positioned at key geographic points. 16:9 widescreen format with fully customizable shapes, text, and color elements.
Related Products
-

Visualizing Global Journey Slide – Harmony of Blue and Pink
#Company Introduction #Market and Competitor Analysis #Diagram
-

Key Regional Hubs Visualization – Showcasing Enhanced Connectivity
#Company Introduction #Market and Competitor Analysis #Diagram
-

Slide to Select Countries to Explore
#Market and Competitor Analysis #Diagram #Other
-

Stylish Graphic World Map Slide
#Company Introduction #Market and Competitor Analysis #Diagram
