Remodeling Radar Chart – A New Choice in Visual Trends
RJ0800012_18
- Last Update 08/03/2025
- File Size 5.2MB
- # of Slides 2
- File Format PPTX
- Slide Ratio 16:9
- Color
Keywords
About the Product
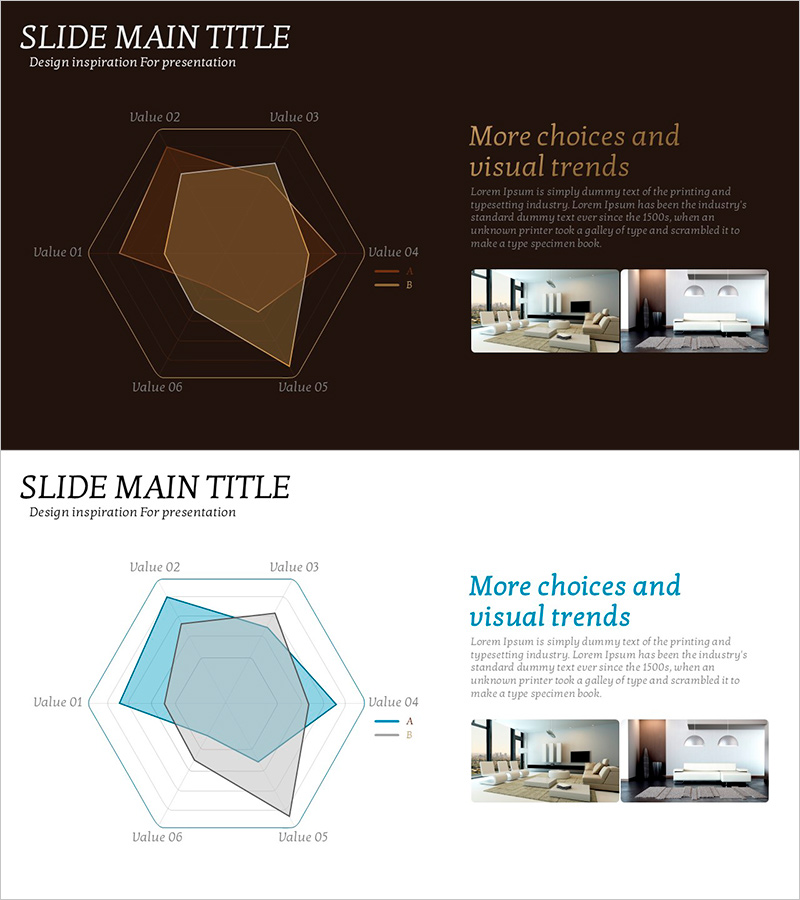
A 6-axis radial diagram PowerPoint slide featuring a nested hexagon structure in gold tones on a dark brown background. This 2-slide set includes a radial comparison chart on the first slide and supplementary text with image gallery on the second. The radial layout enables intuitive visual comparison of multiple data points, making it ideal for product specification analysis, competitive benchmarking, capability assessment, and strategic presentations. Each axis can be customized with labels and values to represent different metrics or attributes.
Usage Points
-
Main Usage
This radial diagram is optimized for comparing six data points or attributes simultaneously. It effectively visualizes product specifications, organizational capabilities, market analysis metrics, and performance indicators. The nested hexagon structure allows viewers to quickly identify strengths and weaknesses across multiple dimensions.
-
How to Use
Input numerical values or ratings into the six axes on the first slide to represent each metric. Use the second slide to add explanatory text and supporting images that reinforce your analysis. The gold-tone color scheme conveys premium positioning, making it suitable for executive briefings, investor pitches, and high-stakes client presentations.
-
Recommended For
Marketing professionals conducting competitive analysis, product managers comparing specifications, executives presenting capability assessments, management consultants delivering diagnostic findings, and sales teams proposing solutions. Particularly effective when presenting quantitative data with qualitative interpretation.
-
Slide Structure
Slide 1: 6-axis radial diagram with center point, three-layer nested hexagon structure, labeled axes. Slide 2: Title area, body text block (right side), two-image gallery (lower right). 16:9 widescreen format, 2-slide set.
Related Products
-

Step Setting Roadmap – Business Strategy Implementation
#Business Strategy #Business Management #Diagram
-

Exploring Three Network Solutions – Business Vision and Cluster Collaboration
#Business Vision and Strategy #Operational Plan #Diagram
-

Business Area Introduction Slide – Vision and Opportunities for Business
#Company Introduction #Business Introduction #Diagram
-

Traditional PPT Future Goals and Schedule Plan – Vision-Embedded Cluster
#Company Introduction #Business Vision and Strategy #Diagram
