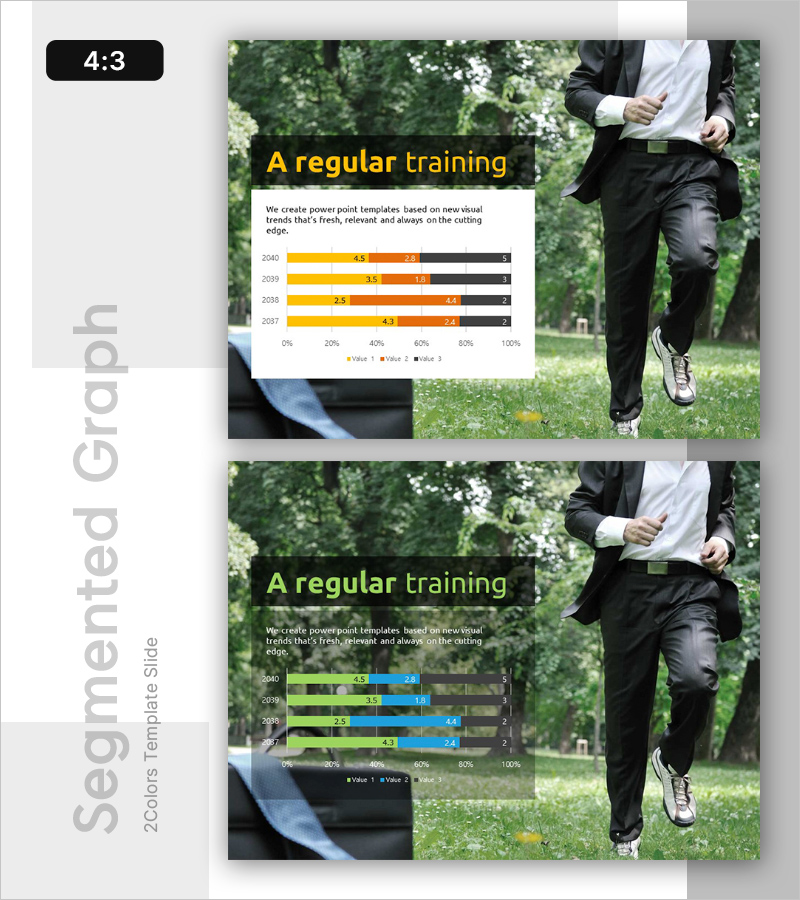
Bar Chart for Competitor Analysis – Regular Training Data
RL0100065_4
- Last Update 01/22/2025
- File Size 0.5MB
- # of Slides 2
- File Format PPTX
- Slide Ratio 4:3
- Color
Keywords
About the Product
This slide is designed to effectively analyze competitor data using a bar chart. The prominent colors of yellow and green enhance visual focus, making the data structure clear and recognizable. It is especially suitable for market and competitor analysis presentations, conveying reliability through the theme of 'Regular Training Data'. The text and data areas are easy to replace, with an overall editing difficulty rated as 'easy', allowing for seamless integration into various business presentations.
Usage Points
-
Main Usage
- This template is particularly useful for presenting competitive analysis findings during strategic meetings, where clarity of data representation is essential for informed decision-making.
-
How to Use
- Utilize this template during quarterly business reviews to effectively communicate market positioning, allowing teams to compare performance metrics and identify areas for growth.
-
Recommended For
- Ideal for marketing analysts and business strategists who need a reliable framework for compiling and presenting competitive insights in a clear and structured manner.
-
Slide Structure
- The overall flow of this presentation set includes an introduction to the competitive landscape, followed by detailed bar charts that highlight specific metrics, and concludes with actionable insights based on the analyzed data.
Related Products
-

The Little Witch and the Text Box – A Presentation Conveying Courage and Overcoming
#Emotional Messages
-

Rest in Nature – Challenge and Freedom
#Emotional Messages #Text Box #Sticky Note
-

A Child Playing with an Airplane Toy – Joy and Imagination
#Emotional Messages
-

No Pains, No Gains – Overcoming Challenges
#Emotional Messages
