Sleek Diagram & Chart – Innovation and Efficiency
RJ0700021_19
- Last Update 07/28/2025
- File Size 0.8MB
- # of Slides 2
- File Format PPTX
- Slide Ratio 16:9
- Color
Keywords
About the Product
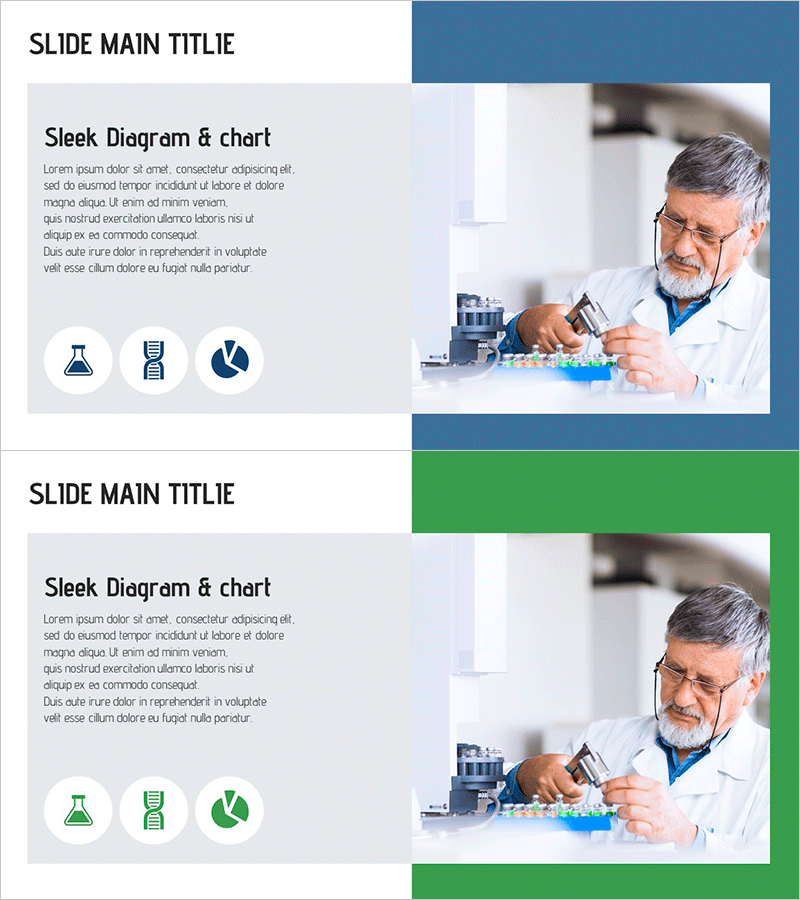
A 2-slide PowerPoint presentation template designed to communicate business overview and innovation strategy through visual elements. The asymmetrical layout features a left text area and right image space, with title, descriptive text, and three icons (flask, DNA helix, pie chart) arranged for maximum impact. Blue and green dual-tone header bars contrast with a light background, emphasizing scientific and technical credibility. This presentation slide is ready to use for corporate introductions, product explanations, and strategic pitches.
Usage Points
-
Main Usage
This slide effectively communicates a company's innovation capabilities, efficiency, and technical excellence at a glance. The left text area conveys core messages while the right image and icons build visual credibility. Ideal for business overview, product introduction, and technology explanation sections.
-
How to Use
Replace the left-side title and body text with your own content. Insert company logos, product photos, or relevant images in the right image area. The three icons represent key values (innovation, efficiency, technology) and can be customized by changing colors or swapping icons. Header colors can be adjusted to match your corporate brand palette.
-
Recommended For
Recommended for tech, science, manufacturing, and finance sectors where technical credibility is essential. Perfect for executive presentations, investor pitches, and product launch events. Ideal for C-suite executives, marketing teams, and technical teams explaining business strategy and innovation capabilities.
-
Slide Structure
The 2-slide set features a consistent layout: left text block (1-line title + 5-6 lines of body text) paired with a right image area (16:9 ratio). A colored header bar (blue or green) at the top contains the main title, while three circular icons are arranged horizontally at the bottom left. The information hierarchy is simple and instantly comprehensible.
Related Products
-

Heart Drop Connection Diagram - Ideal for Business Introduction Infographics
#Business Introduction #Diagram #Business Areas
-

Big Data Analysis Company Overview - Current Data Trends
#Company Introduction #Business Introduction #Company Overview
-

Data Analytics Business Overview – Effective Business Introduction Slide
#Company Introduction #Business Introduction #Company Overview
-

Overview of Mobile Phone Service Business
#Company Introduction #Business Introduction #Graph
