Diagram for Explaining Brain – Ringer Shape Subdivided Column Graph
RJ0700017_22
- Last Update 07/26/2025
- File Size 0.5MB
- # of Slides 2
- File Format PPTX
- Slide Ratio 16:9
- Color
Keywords
- #Content-Based Slides
- #Design-Based Slides
- #Business Introduction
- #Business Vision and Strategy
- #Diagram
- #Business Areas
- #Core Competencies
- #Spread
- #Centralized Diagram
- #16:9
- #radial diagram PowerPoint
- #brain explanation slide
- #center radial graph
- #core competency diagram
- #business presentation template
About the Product
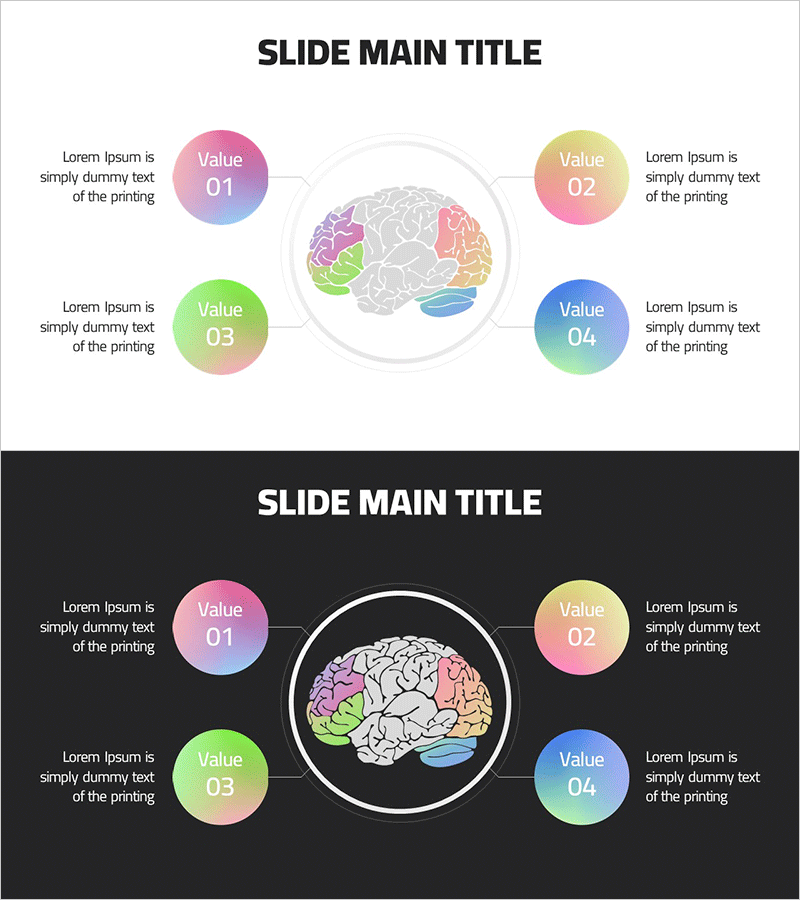
A radial diagram PowerPoint slide designed to explain brain regions and their functions. The central brain illustration is surrounded by four color-gradient circular nodes (Value 01–04) arranged in a radial pattern, intuitively representing each area's role. Pink, yellow, green, and blue gradient buttons connected by lines clarify hierarchical relationships, with text description areas for each item. Provided in two background versions (light and dark) for flexible presentation environments. Available in 16:9 PPTX format for immediate editing and use.
Usage Points
-
Main Usage
Visually explains brain regions and their functions, and represents organizational core competencies or business areas radiating from a central concept. Ideal for neuroscience, education, organizational development, and marketing strategy presentations.
-
How to Use
Set the central brain image as the main topic and the four radial nodes as subtopics. Edit node text and description areas with specific content, and adjust node colors or item count as needed. Light backgrounds suit daytime presentations; dark backgrounds work well for evening or video environments.
-
Recommended For
Recommended for neuroscientists, educators, organizational development specialists, marketing planners, and executive presentations. Particularly effective for brain function explanations, organizational structure introductions, core competency emphasis, and business area classifications.
-
Slide Structure
Central brain image surrounded by four color-gradient circular nodes (pink, yellow, green, blue) positioned top, bottom, left, and right, each connected to the center by lines. Text description areas appear beside each node. Comprises two slides with light and dark background versions.
Related Products
-

Core Competencies for Problem Solving – Business Cluster Diagram
#Business Introduction #Business Vision and Strategy #Diagram
-

Space Industry Core Competency Diagram – Future Strategy of Business
#Business Introduction #Business Vision and Strategy #Diagram
-

Medical Diffusion Diagram – Conveying Business Strategy and Vision
#Business Introduction #Business Vision and Strategy #Diagram
-

Core Capabilities for Sustainable Operations – Stylish Cluster Diagram
#Business Introduction #Business Vision and Strategy #Diagram
