Business Area Gradient Diagram – Perfect for Business Introduction
RJ0700015_6
- Last Update 10/06/2025
- File Size 0.7MB
- # of Slides 2
- File Format PPTX
- Slide Ratio 16:9
- Color
Keywords
- #Content-Based Slides
- #Design-Based Slides
- #Company Introduction
- #Business Introduction
- #Diagram
- #Business Areas
- #Business Areas
- #Spread
- #Centralized Diagram
- #16:9
- #radial diagram PowerPoint
- #center diagram slide template
- #business area diagram
- #4-area radial chart
- #gradient PowerPoint slide
- #organizational structure presentation
- #how to create radial diagram in PowerPoint
About the Product
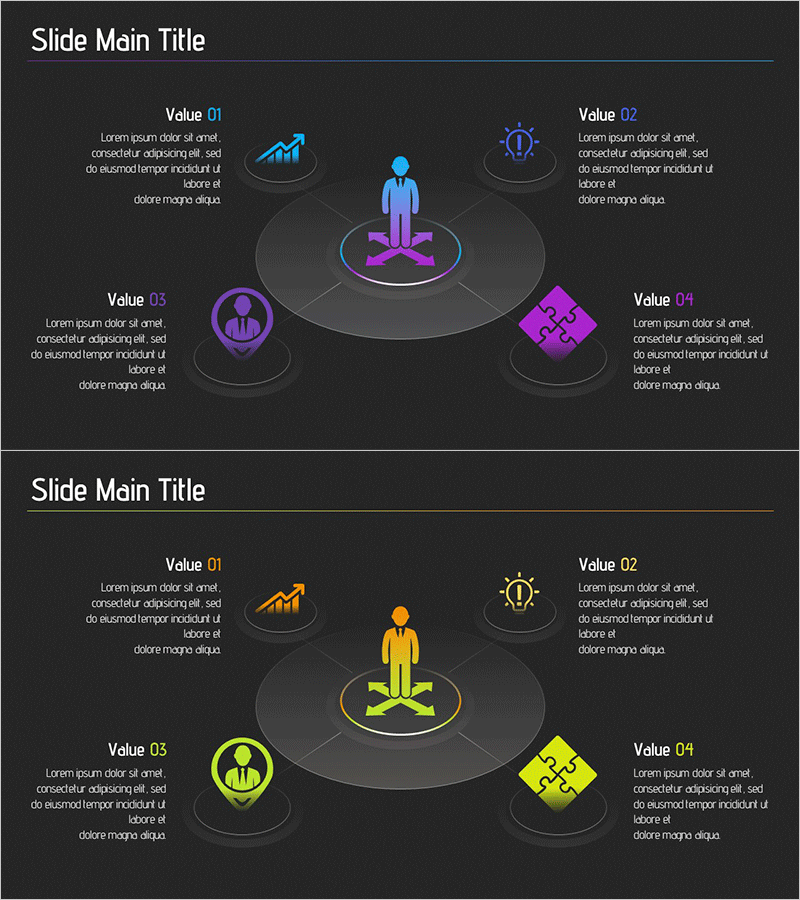
A PowerPoint slide featuring a radial diagram with a central core element and four surrounding areas extending outward in a balanced, symmetrical layout. The design uses blue, purple, and yellow gradient colors to distinguish each area, with icons and text boxes for clear information hierarchy. The 2-slide set includes the same radial structure with color variations (purple-blue and yellow-orange gradients), ensuring consistent visual branding throughout your presentation. Ideal for business introductions, organizational structures, strategic frameworks, and multi-element comparisons that require equal emphasis on four key components.
Usage Points
-
Main Usage
Visually communicate hierarchical relationships and interconnections by placing a core message at the center and extending four supporting elements outward in a balanced radial pattern. This structure emphasizes the central concept while giving equal visual weight to four complementary areas or components.
-
How to Use
Use in corporate introduction presentations to explain business divisions, organizational departments, or strategic pillars. Adapt for marketing decks presenting four key strategies, product lines, or market segments. Customize the central icon and four surrounding text boxes to match your specific content structure and messaging.
-
Recommended For
Business executives, marketing managers, and strategy teams presenting to stakeholders, investors, or clients. Particularly effective when you need to highlight four equally important elements (four business units, four core values, four strategic initiatives, or four market segments) in a single visual.
-
Slide Structure
Two-slide set with identical radial layout. Central area contains primary icon and text input field. Four directional nodes (top, bottom, left, right) each feature a circular container with accompanying text box. Slide 1 uses purple-blue gradient; Slide 2 uses yellow-orange gradient for visual variety while maintaining structural consistency.
Related Products
-

Financial Management Services Area Diagram – Visualizing Business Areas
#Company Introduction #Business Introduction #Diagram
-

Vaccine Diffusion Diagram – Business Introduction and Diffusion Strategy
#Company Introduction #Business Introduction #Diagram
-

Card Payment Service Area Diagram – Business Sector Introduction
#Company Introduction #Business Introduction #Diagram
-

Astronomy Earth Diagram PowerPoint – Visual Exploration
#Company Introduction #Business Introduction #Diagram
