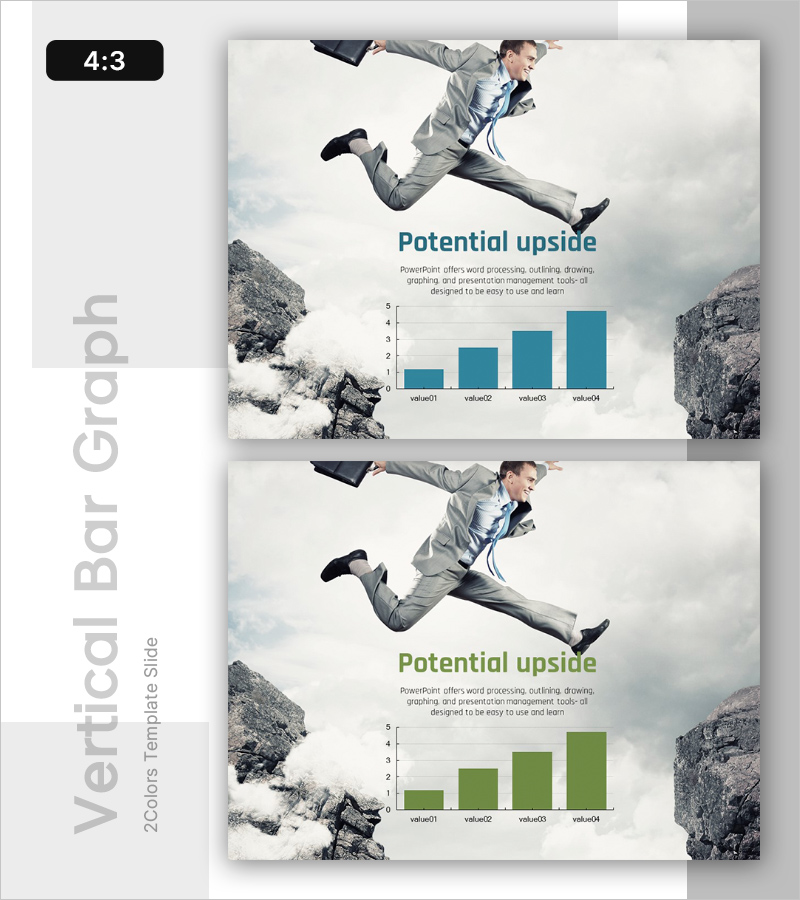
Potential Upside Analysis Graph
RL0100056_4
- Last Update 01/21/2025
- File Size 1.7MB
- # of Slides 2
- File Format PPTX
- Slide Ratio 4:3
- Color
Keywords
About the Product
This slide is designed to effectively analyze potential upsides through a graph format. The harmonious color palette of blue and green conveys trust and stability while the main message at the top increases engagement. By visually representing market status and competitor analysis data, it helps prepare effective business strategies.
Usage Points
-
Main Usage
- This template is most suitable for presenting market analysis during strategic planning meetings, where insights regarding potential opportunities are crucial for decision-making.
-
How to Use
- Utilize this slide during stakeholder presentations to effectively communicate data-driven insights, ensuring that all participants can follow the visual narrative and contribute to discussions on future initiatives.
-
Recommended For
- Ideal for business analysts, marketing teams, and executives who are involved in strategic planning and require clear visual aids to support their recommendations and analyses.
-
Slide Structure
- The overall flow includes an introduction to market trends, followed by sections for competitor analysis and potential growth areas, culminating in actionable recommendations for business strategies.


