Radial Graph of Space Industry - Modern Design
RJ0700006_8
- Last Update 07/23/2025
- File Size 1.8MB
- # of Slides 2
- File Format PPTX
- Slide Ratio 16:9
- Color
Keywords
- #Content-Based Slides
- #Design-Based Slides
- #Company Introduction
- #Business Introduction
- #Graph
- #Business Areas
- #Business Areas
- #Other
- #Radar Chart Spider Chart
- #16:9
- #radial graph PowerPoint slide
- #space industry presentation template
- #radial diagram chart
- #5-node data visualization
- #hub-and-spoke diagram download
About the Product
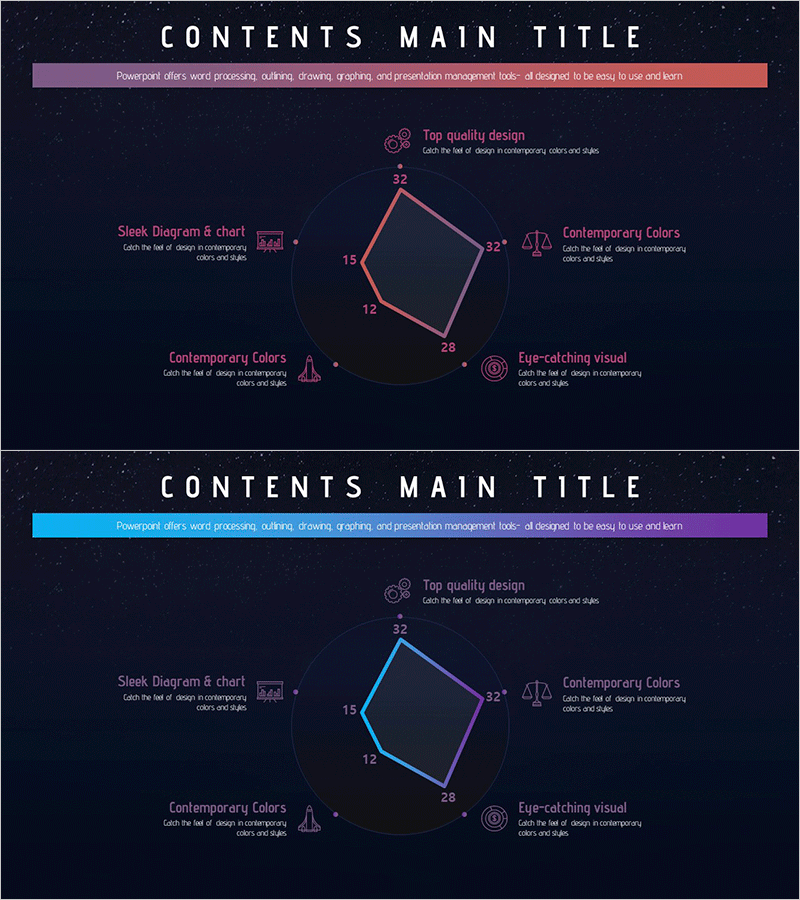
A radial diagram PowerPoint slide visualizing five key elements of the space industry with a central hub-and-spoke structure. Set against a dark navy background, the design features gradient lines in pink, lavender, and cyan that radiate from the center node to five surrounding data points. Each node includes numerical labels and icons for clear information hierarchy. The 2-slide deck offers color variations (pink and cyan tones) to match different presentation contexts. Fully editable in 16:9 widescreen PPTX format, ideal for business analysis, technology architecture, organizational roles, and strategic planning presentations.
Usage Points
-
Main Usage
Visualizes core elements of space industry, technology, or organizational structure using a radial pattern that emphasizes central concepts radiating outward. Effectively communicates hierarchical relationships, multi-item comparisons, and interconnected data across business analysis, technology architecture, organizational roles, and strategic initiatives.
-
How to Use
Enter the central concept (industry name, technology, or organization) in the hub node, then populate the five surrounding nodes with detailed elements and numerical data. Color-variant slides allow tone adjustment for different audiences. All text, numbers, and icons are fully editable to match your specific content.
-
Recommended For
Ideal for aerospace and space industry business presentations, technology explanations, and organizational structure overviews. Also suitable for IT, science, and manufacturing sectors presenting technical architecture, multi-channel marketing strategies, and executive summary reports. Perfect for presentations to executives, investors, and clients requiring clear data hierarchy.
-
Slide Structure
2-slide set: Slide 1 features pink-tone radial graph with 1 central hub node and 5 peripheral data nodes; Slide 2 presents identical structure in cyan tone. Each node displays numerical labels (12, 15, 22, 28, 32) with accompanying icons. Dark navy background with gradient lines and star pattern elements reinforce the space theme.
Related Products
-

Banking Services Business Sector Diagram
#Company Introduction #Business Introduction #Diagram
-

Financial Business Area Circular Diagram – Effective Visualization for Business Introduction
#Company Introduction #Business Introduction #Diagram
-

Financial Business Area Slide – Modern Diagram
#Company Introduction #Business Introduction #Diagram
-

Logistics Transportation Service Area Diagram – Visual Innovation
#Company Introduction #Business Introduction #Diagram
