Donut Graph for Market Share Analysis
RL0100051_4
- Last Update 01/21/2025
- File Size 5.9MB
- # of Slides 2
- File Format PPTX
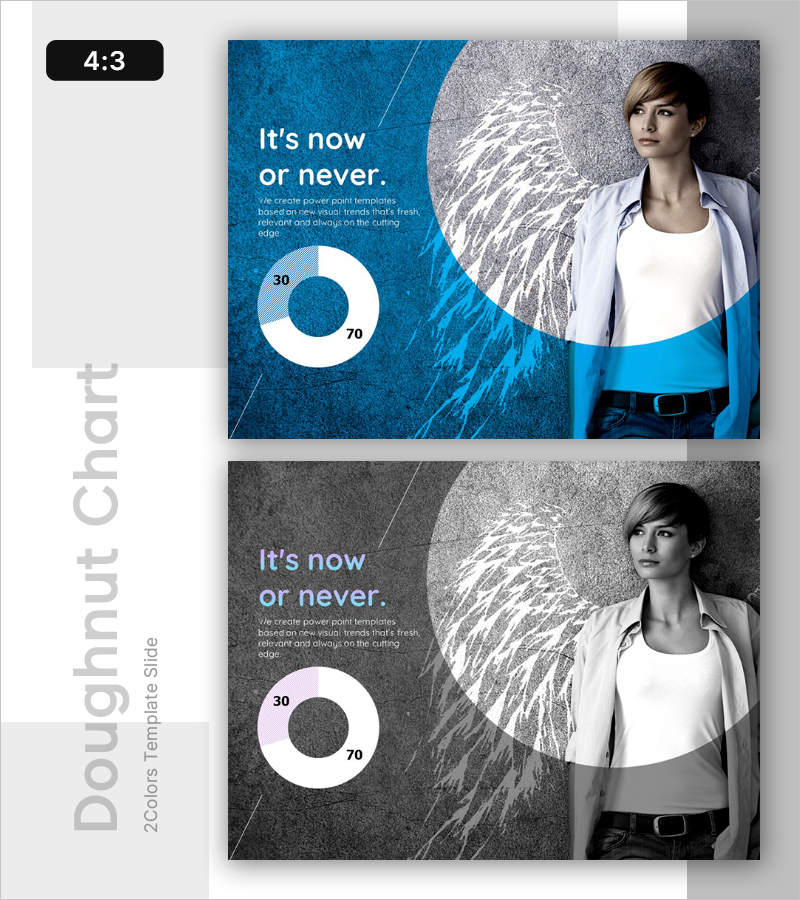
- Slide Ratio 4:3
- Color
Keywords
About the Product
A professional donut chart PowerPoint slide designed to visualize market share and competitive positioning at a glance. The slide features a textured blue background with a white donut chart, combining a left-side text area for key messaging with a right-side portrait image to build credibility. The 2-slide set includes identical layouts in both blue and gray color versions, allowing you to match your brand guidelines and presentation context. The 30:70 ratio data is intuitively represented, making it immediately applicable for investor presentations, executive briefings, and marketing strategy discussions where data-driven decision-making is essential.
Usage Points
-
Main Usage
Communicate market position and competitive strength to investors, executives, and partners by visualizing two-part ratio data (such as market share or performance metrics) through an intuitive donut chart format.
-
How to Use
Enter your key message and supporting text in the left text area, replace the donut chart values (30, 70) with your actual data, and swap the right-side portrait image with your company representative or team member photo. All elements are fully editable.
-
Recommended For
Ideal for investor relations materials, executive reports, marketing strategy presentations, business performance analysis, and market research reports where quantitative data visualization is critical for B2B audiences.
-
Slide Structure
Two-slide set with identical layouts in blue and gray color versions. Each slide is divided into three sections: left text input area (title and description), center donut chart with two data values, and right portrait image area. Optimized for 4:3 aspect ratio.
Related Products
-

Radical Social Advancement – Innovation through Visual Appeal
#Emotional Messages
-

Potential Template Cover – A Professional and Emotional Start
#Emotional Messages
-

Business Idea Analysis Graph – Innovation and Vision
#Emotional Messages
-

Corporate Future Outlook Analysis Graph – Visualizing Future Predictions
#Emotional Messages
