Bar Graph of Future Outlook Analysis – Strategy for the Future
RL0100044_3
- Last Update 01/20/2025
- File Size 1.6MB
- # of Slides 2
- File Format PPTX
- Slide Ratio 4:3
- Color
Keywords
About the Product
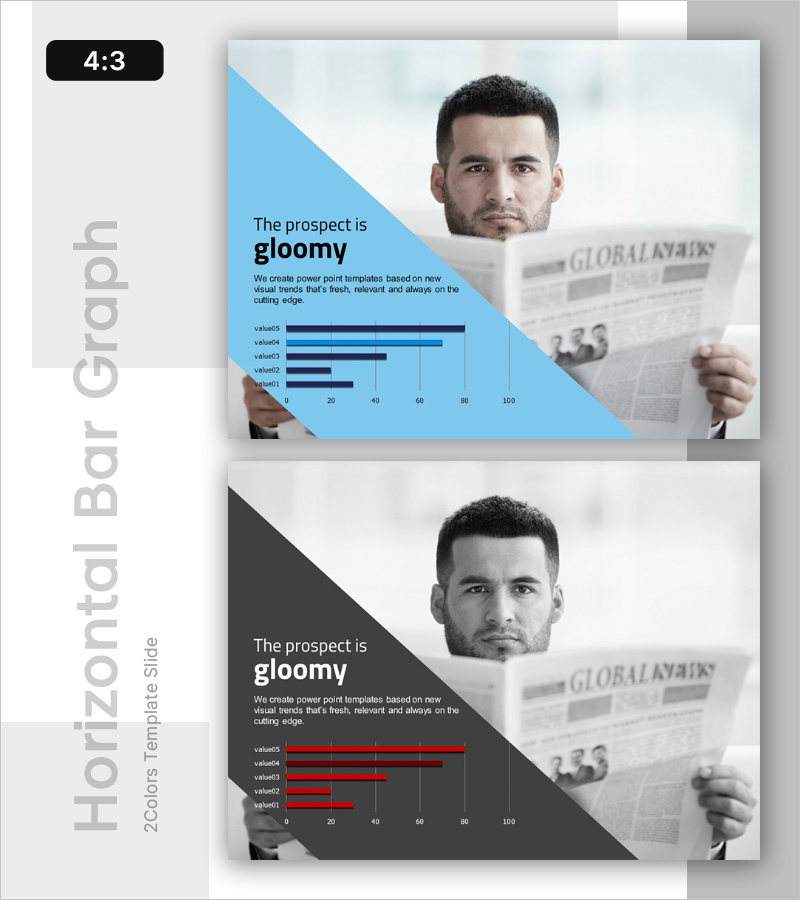
A 2-slide bar graph PowerPoint template designed to visualize future market prospects and competitive analysis. Available in both blue and red color schemes, each slide features a diagonal geometric layout combined with professional portrait photography for credibility. The template accommodates five data items displayed as horizontal bars for easy comparison, with title and descriptive text areas positioned on the left. Provided in 4:3 aspect ratio PPTX format for immediate editing. Ideal for executive reports, investor presentations, market analysis briefings, and strategic forecasting where data-driven insights need clear visual communication.
Usage Points
-
Main Usage
Communicate future market trends, competitive positioning, and forecast data through horizontal bar visualization. Enables stakeholders and investors to quickly grasp comparative insights across five key metrics, supporting data-driven decision-making.
-
How to Use
Enter your analysis topic in the title area (e.g., market growth rate, competitor market share) and key message in the description field. Replace value01–value05 labels and corresponding bar values with your actual data. Slide is ready to use immediately after data entry.
-
Recommended For
Executive presentations, investor relations (IR) meetings, market analysis briefings, business plan presentations, quarterly performance reports, competitive landscape analysis, strategic planning sessions, and any business context requiring data visualization for decision support.
-
Slide Structure
Two-slide set: blue version and red version. Each slide combines a left diagonal geometric section (title, description, and 5-item horizontal bar chart) with right-side professional portrait background. Optimized for 4:3 aspect ratio display.
Related Products
-

Future-oriented Template Cover – Bright Vision Ahead
#Emotional Messages
-

Radical Social Advancement – Innovation through Visual Appeal
#Emotional Messages
-

AI Innovation Business Ideas Slide – Creative Visualization
#Emotional Messages
-

Business Idea Analysis Graph – Innovation and Vision
#Emotional Messages
