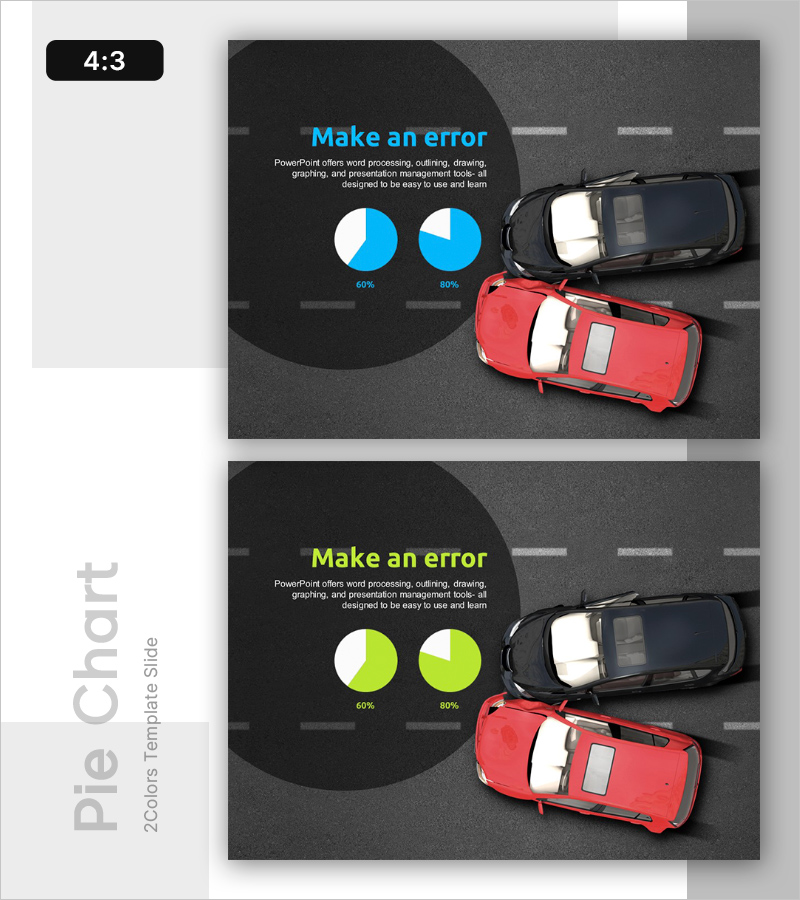
Pie Donut Chart – Optimal for Market and Competition Analysis
RL0100042_4
- Last Update 01/20/2025
- File Size 2.3MB
- # of Slides 2
- File Format PPTX
- Slide Ratio 4:3
- Color
Keywords
About the Product
This slide features a pie donut chart designed to distinctly present information regarding market share and competitor analysis. Utilizing a vibrant color palette (blue, green, red), it effectively emphasizes data, while also ensuring aesthetic appeal. It is ideally suited for presentations targeted at investors and executives, providing an intuitive display of data distribution and proportions. With easy replacement of text and graphs, the editing difficulty is classified as 'moderate', making it feasible for various contexts.
Usage Points
-
Main Usage
- This template is ideal for showcasing market share insights during investment pitches or business strategy meetings, where clear data representation is crucial for informed decision-making.
-
How to Use
- During quarterly reviews, this template can be adapted to display real-time data, making it suitable for internal team discussions or stakeholder updates that require visual clarity.
-
Recommended For
- Business analysts and corporate strategists who need to convey complex market dynamics in a straightforward manner will find this template particularly useful for their presentations.
-
Slide Structure
- The structure typically begins with an overview slide, followed by detailed segments that break down competitor analysis and market distribution, ensuring a logical progression that aids comprehension.
Related Products
-

Strong Business Competitive Strategy Slide Template
#Emotional Messages
-

Competitor Comparison Analysis Graph – Summarizing Market Status
#Emotional Messages
-

Business Failure Analysis Graph – Essential Tool for Market and Competitor Analysis
#Emotional Messages
-

Wishing you success after setbacks Slide
#Emotional Messages
