Life Tube Diagram for Risk Management Visualization
RJ0600095_18
- Last Update 07/16/2025
- File Size 0.6MB
- # of Slides 2
- File Format PPTX
- Slide Ratio 16:9
- Color
Keywords
- #Content-Based Slides
- #Design-Based Slides
- #Operational Plan
- #Risk Management and Regulatory Compliance
- #Diagram
- #Risk Management
- # Risk Management Strategy
- #Cluster
- #Chain Diagram
- #16:9
- #life tube diagram PowerPoint
- #5-stage flow diagram presentation
- #risk management slide template
- #operational planning diagram
- #donut diagram PPT download
About the Product
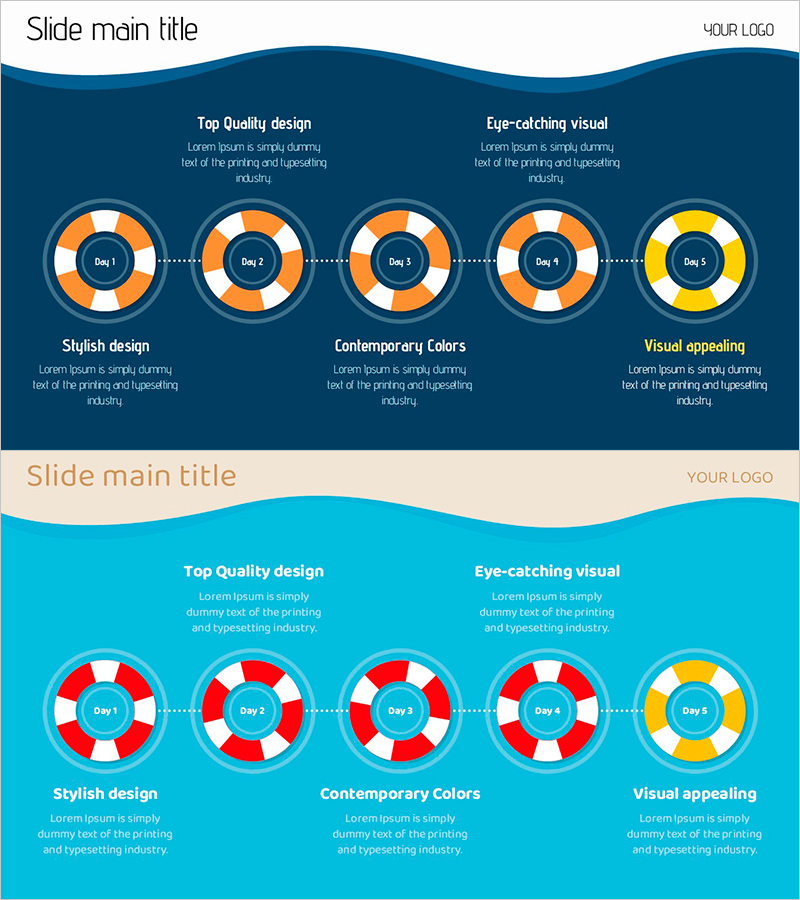
A 5-stage life tube diagram PowerPoint slide for visualizing risk management and operational planning. The slide features a dark blue background with orange and yellow donut-shaped nodes connected by dotted lines in a linear flow structure, clearly expressing risk factors and mitigation strategies at each stage. The 16:9 format includes 2 slides ready for immediate use in presentations, with fully editable colors and text. Ideal for business strategy, project management, risk analysis, and other presentations requiring effective data flow visualization.
Usage Points
-
Main Usage
Visualizes risk management, operational planning, and project stage progression through a 5-stage flow. Each stage is represented as a donut-shaped node to clearly communicate cyclical processes and stage-specific risks, making it ideal for executive reports, strategy presentations, and team meetings.
-
How to Use
The 2-slide set includes a complete 5-node flow overview on the first slide and detailed explanation areas on the second. Customize each node's text and color to match project stage names, risk levels, and mitigation strategies, then adapt the layout to your presentation context.
-
Recommended For
Executives, project managers, risk management specialists, and operations planning teams explaining stage-by-stage progress and risk factors. Suitable for business strategy development, project kickoffs, risk analysis meetings, and quarterly performance reports requiring clear data flow communication.
-
Slide Structure
Dark blue background with 5 donut-shaped nodes sequentially connected by dotted lines. Each node uses orange-white or yellow-white color combinations to indicate stage status, with 'Day 1–5' text input areas in the node centers and 3 description text boxes positioned at the bottom for detailed explanations.
Related Products
-

How to Deal with a Crisis in Case of an Accident - Effective Risk Management Tool
#Operational Plan #Risk Management and Regulatory Compliance #Diagram
-

Safety Management System – Optimized Diagram for Risks and Compliance
#Operational Plan #Risk Management and Regulatory Compliance #Diagram
-

Eco-friendly Business System Structure – Blue Green Diagram
#Operational Plan #Technical Approach #Diagram
-

Construction Work Flow System – Efficient Operation Planning and Risk Management
#Operational Plan #Diagram #Business Processes
