Map Slide Template for Geographic Data Visualization – Innovative Approach
RJ0600093_21
- Last Update 07/15/2025
- File Size 0.4MB
- # of Slides 2
- File Format PPTX
- Slide Ratio 16:9
- Color
Keywords
About the Product
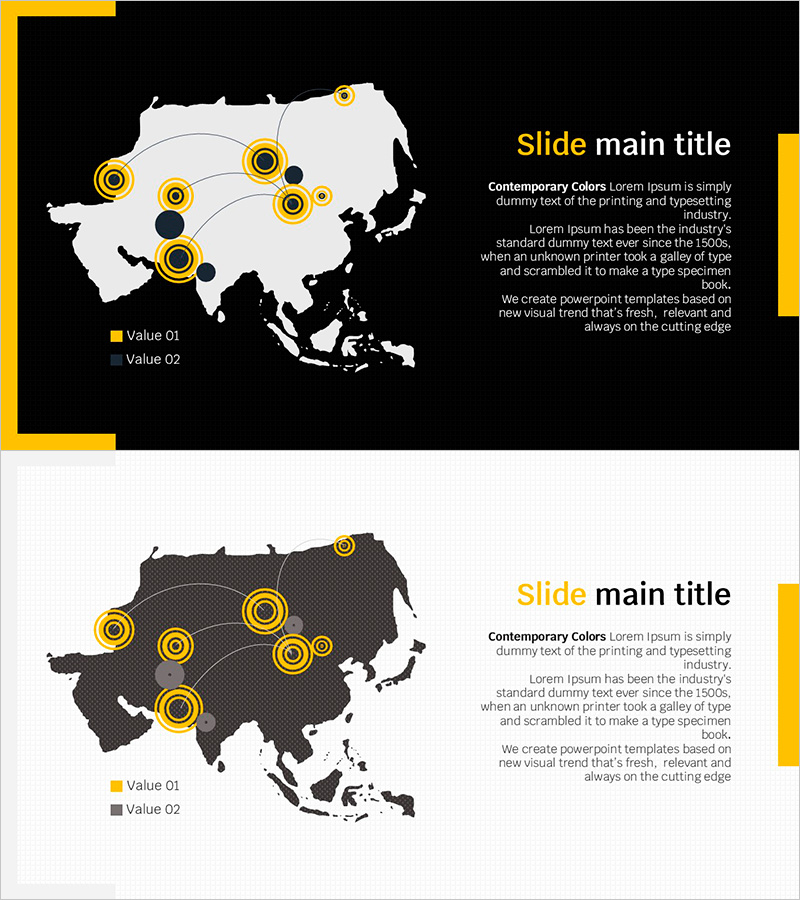
A 2-slide PowerPoint presentation template for visualizing geographic data across Asia with precision and clarity. The design features a minimalist layout with black backgrounds and yellow accent lines, using circular markers and connecting lines to highlight regional data points on the map. The first slide displays a light gray map with yellow circular markers, while the second slide applies the same marker structure to a darker map tone, ensuring compatibility with various presentation environments. A legend (Value 01, Value 02) distinguishes data categories, with dedicated text areas on the right for title and description input. This slide deck is ready to use for business strategy presentations, market analysis reports, and global expansion planning discussions.
Usage Points
-
Main Usage
Designed for global business strategy, market entry planning, and regional performance analysis presentations. Displays key locations, sales offices, and partner sites on the Asia map, enhancing audience comprehension of geographic distribution and market reach.
-
How to Use
Click on the yellow circular markers to edit color, size, and position. Input your presentation title and description in the right-side text box, and customize the legend to match your data categories. Two background versions (light and dark) are provided—select based on your presentation venue lighting conditions.
-
Recommended For
Executives, marketing teams, sales departments, and strategic planning teams presenting regional performance, market share, and expansion plans. Ideal for investor presentations, employee training sessions, and partner meetings where geographic data clarity is essential.
-
Slide Structure
Each slide contains a left-side map area (Asia map with 5–8 yellow circular markers and connecting lines) and a right-side text area (1 title field, 1 body text field, 2-item legend). Formatted in 16:9 widescreen ratio for modern presentation standards.
Related Products
-

World Map Slide for Market Visualization – Global Growth Potential
#Company Introduction #Business Introduction #Other
-

Global Infrastructure Slide – Visualizing Global Networks
#Company Introduction #Business Introduction #Diagram
-

Global Network Infrastructure – Diverging Flow Diagram
#Company Introduction #Business Introduction #Diagram
-

Global Partnership Mediated by Nature – Eco-Friendly Design
#Company Introduction #Business Introduction #Diagram
