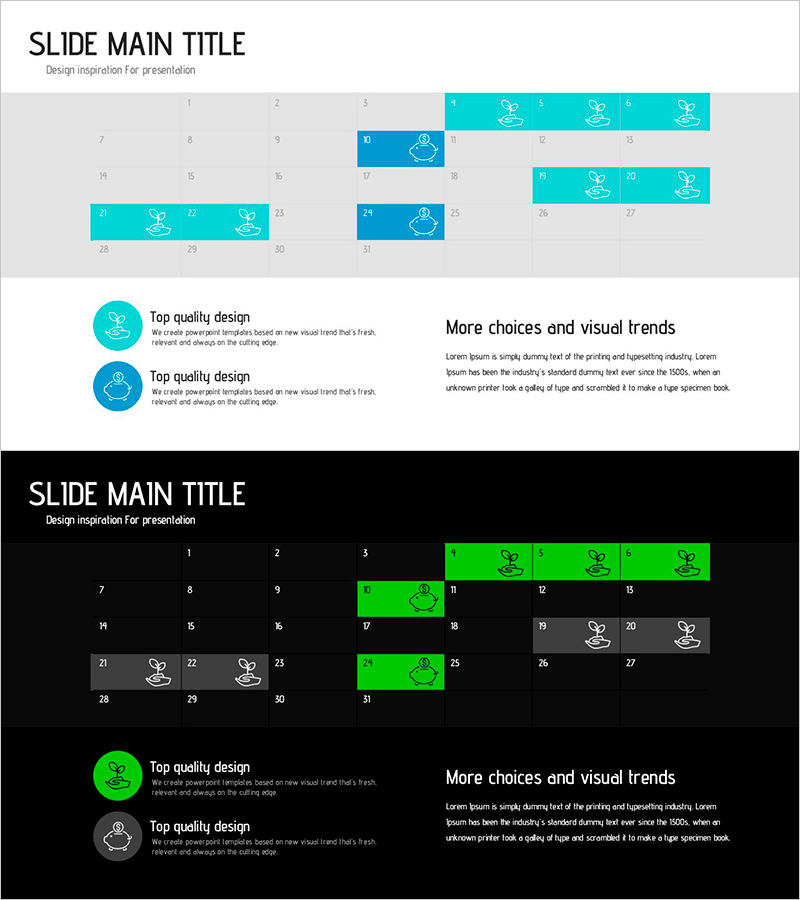
Blue Green Schedule Table – Useful Diagram
RJ0600088_29
- Last Update 07/14/2025
- File Size 0.4MB
- # of Slides 2
- File Format PPTX
- Slide Ratio 16:9
- Color
Keywords
About the Product
A table-style diagram PowerPoint slide designed to visualize project schedules and timelines with clarity. This 2-slide set features a teal color palette that makes monthly, weekly, and phase-based schedules easy to understand at a glance. Each cell accommodates icons and text, allowing you to represent task progress, milestones, and key dates effectively. The slides are ready to use in business presentations, project proposals, and strategic planning documents without additional design work.
Usage Points
-
Main Usage
Visualize project schedules, milestones, and task progress in table format to communicate clearly with team members and stakeholders. Organize monthly, weekly, or phase-based timelines and display the status of each item at a glance for better project visibility.
-
How to Use
Customize each cell by entering project phases, responsible parties, estimated durations, and status information. Use during presentations to walk through the timeline, or print and distribute as a team reference document. Leverage colors and icons to differentiate priorities or status levels and enhance visual impact.
-
Recommended For
Project managers, business planners, marketing professionals, and consultants who need to manage schedules and report progress. Ideal for business plans, proposals, quarterly reports, and team meeting materials.
-
Slide Structure
Two-slide set with the first slide featuring a 3-row by 6-column table and the second slide a 2-row by 5-column table layout. Each cell includes a teal background, white text area, and icon placement, optimized for 16:9 widescreen format.
Related Products
-

Colorful Square Text Box - Modern Design and Color Palette
#Diagram
-

Space Industry Vision Diagram – Innovation and Advancement
#Business Vision and Strategy #Diagram #Business Vision
-

Key Financial Indicators Analysis Diagram – Efficient Financial Planning
#Financial Plans and Performance #Diagram #Sales and Revenue
-

Idea Presentation Template Wide Pyramid Diagram
#Marketing Plan and Strategy #Diagram #Marketing Strategy
