Visual Trend Emphasizing Social Contribution System Slide
RJ0600088_26
- Last Update 07/14/2025
- File Size 0.4MB
- # of Slides 2
- File Format PPTX
- Slide Ratio 16:9
- Color
Keywords
- #Content-Based Slides
- #Design-Based Slides
- #Operational Plan
- #Diagram
- #Production and Technology Development Strategy
- #Risk Management
- #Flow
- #Table
- #16:9
- #social contribution PowerPoint slide
- #circular flow diagram slide
- #4-stage system diagram PPT
- #operational planning presentation
- #CSR process PowerPoint
About the Product
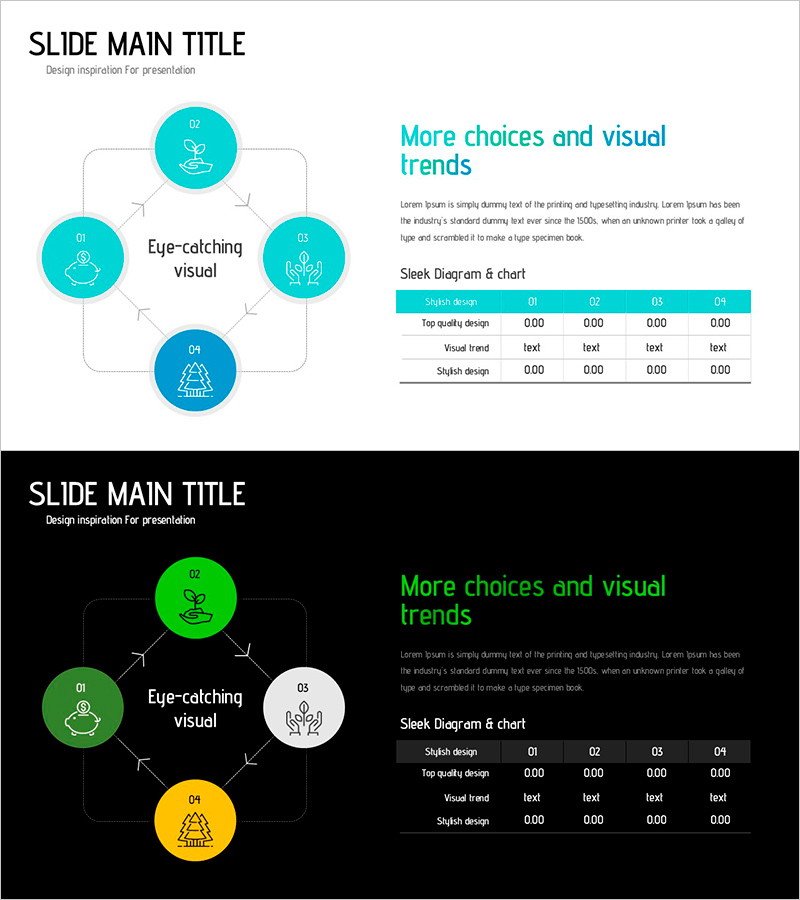
A 2-slide PowerPoint presentation optimized for social contribution and operational planning presentations. The design features a circular flow diagram with four icon-based stages at the center, complemented by a data table on the right side for visual trend analysis. The cyan accent color contrasts with the white background to enhance information readability, and a black background version is also included. The slides provide clearly defined text input areas and chart sections for immediate editing. This PowerPoint slide deck is suitable for presenting organizational operation systems, risk management processes, corporate social responsibility initiatives, and sustainability frameworks across various business contexts.
Usage Points
-
Main Usage
This slide visually communicates an organization's social contribution activities, operational processes, and risk management systems. The four-stage circular structure represents a continuous improvement cycle, while the data table on the right enables simultaneous presentation of quantitative performance metrics.
-
How to Use
Input stage-specific activity names (planning, execution, evaluation, improvement, etc.) into each circular icon on the left diagram, then populate the right-side table with corresponding indicators and numerical data. Use the black background version for outdoor projection or high-contrast presentation environments, and the cyan version for indoor conference room presentations.
-
Recommended For
Ideal for corporate sustainability reports, social contribution activity presentations, operational system explanations, risk management process sharing, and organizational improvement planning meetings. Particularly effective for executive board presentations and stakeholder communications emphasizing systematic operational capabilities.
-
Slide Structure
Each slide comprises a left-side 4-icon circular diagram (4 text input areas) + center 'Eye-catching visual' label + right-side title and descriptive text (2 input areas) + data table (3 rows, 5 columns). Provided in 2-slide format with color variations (cyan and black backgrounds).
Related Products
-

Diagram Using Coffee Beans for Visualizing Operations Strategy – Efficient Production Management
#Operational Plan #Diagram #Production and Technology Development Strategy
-

Visualizing Operations Plan with Circular Circulation Diagram – Risk Management Strategy
#Operational Plan #Diagram #Production and Technology Development Strategy
-

Precautions for Excessive Alcohol Consumption Slide Template – Guidance for Safe Consumption
#Operational Plan #Diagram #Production and Technology Development Strategy
-

Technology Development Strategy Diagram – Presenting Sustainable Growth Directions
#Operational Plan #Technical Approach #Diagram
