Chromosome Themed Wide PowerPoint Template – Innovation and Challenge
RL0100028_4
- Last Update 01/20/2025
- File Size 1.2MB
- # of Slides 2
- File Format PPTX
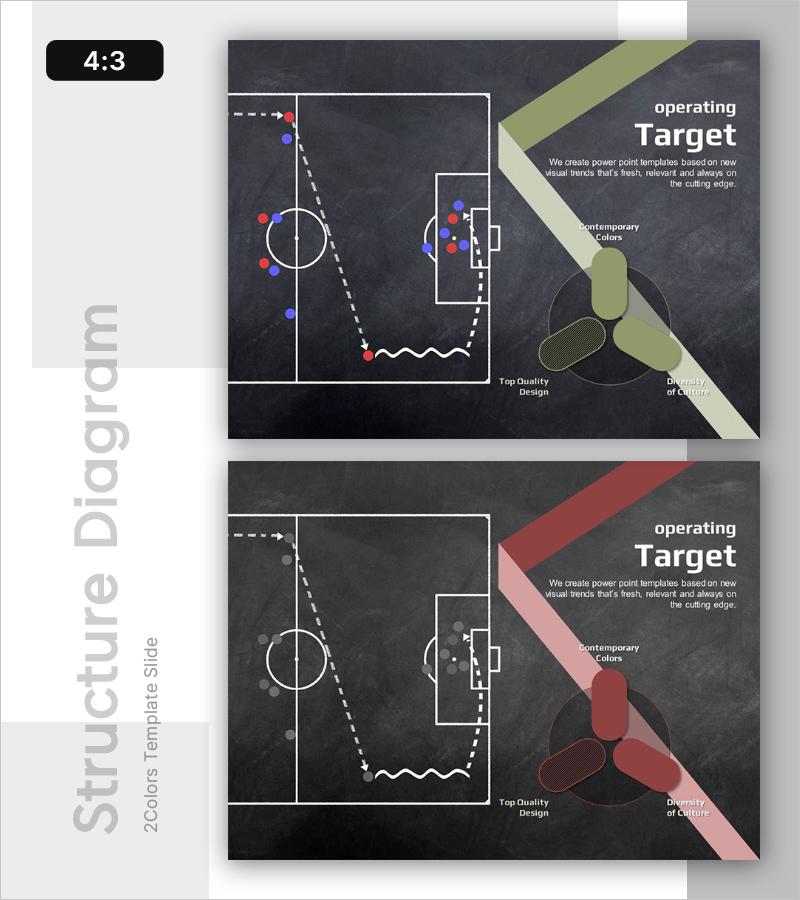
- Slide Ratio 4:3
- Color
Keywords
About the Product
A performance and success slide that visualizes innovation and challenge through a chromosome-themed design. Set against a dark charcoal background, this PowerPoint slide features two color variations—olive green and wine red—with chromosome-shaped diagrams that represent the corporate goal achievement process. The left flowchart illustrates process stages, while the right circular diagram emphasizes key elements such as Top Quality Design and Diversity of Culture. Formatted in 4:3 ratio PPTX with 2 slides, the layout balances text areas with data visualization spaces. This presentation slide is ready for immediate use in marketing presentations, strategy sessions, performance reports, and various business communications.
Usage Points
-
Main Usage
This slide effectively communicates corporate performance targets and achievement strategies through visual representation. The left flowchart displays step-by-step processes while the right circular diagram highlights core success factors—quality, diversity, and culture—providing decision-makers and stakeholders with a clear vision.
-
How to Use
Use as the performance section in marketing plans, goal achievement strategy in business reports, or key message slide in strategy presentations. Input specific targets, KPIs, and implementation strategies in the text areas, and adjust diagram colors to match your corporate brand guidelines.
-
Recommended For
Ideal for marketing teams presenting campaign performance, executives in strategy meetings, investor presentations of performance results, and team leaders outlining goal achievement plans. Particularly suited for startups, technology companies, and growth-focused organizations that emphasize innovation and challenge.
-
Slide Structure
Two-slide set with olive green theme on the first slide and wine red theme on the second. Each slide features a left flowchart (accommodating 3-4 stages), a right circular diagram (3 sections), and upper title and description text areas, enabling simultaneous representation of processes and key elements.
Related Products
-

Victory Factor Analysis Graph – Strengthening Market Competitiveness
#Emotional Messages
-

Speed Template Cover – Business Presentation
#Emotional Messages
-

Successful Business Presentation Template Cover
#Emotional Messages
-

Competitive Sports Template Intro – The Beginning of Strategy and Challenge
#Emotional Messages
