Business Progress Analysis Graph – Market and Competitive Insights
RL0100026_4
- Last Update 01/19/2025
- File Size 2.7MB
- # of Slides 2
- File Format PPTX
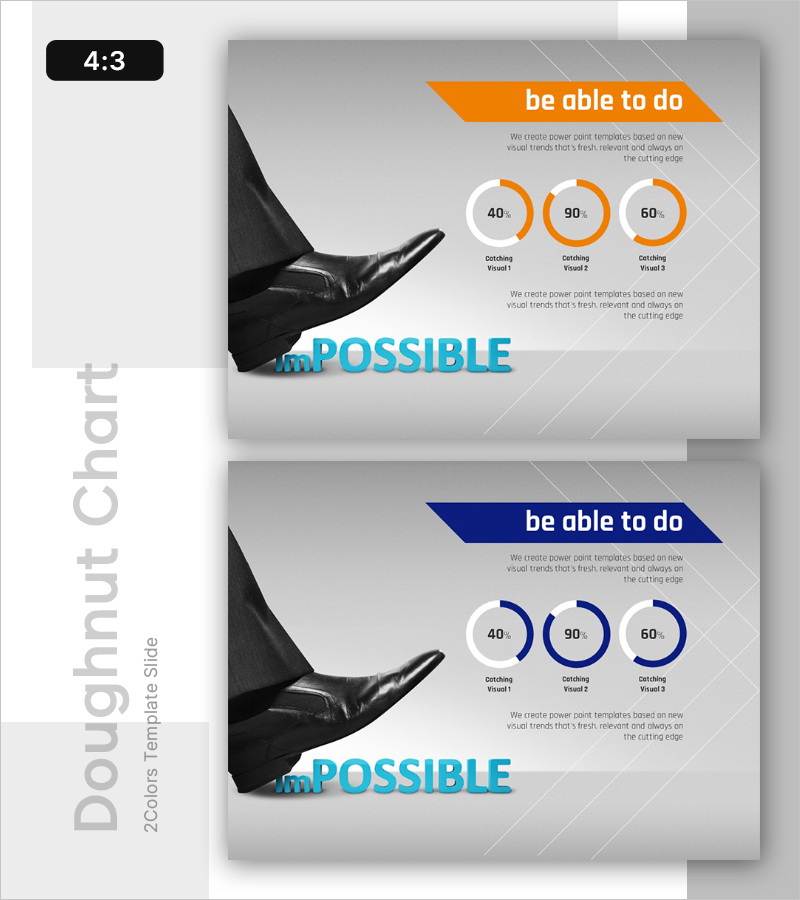
- Slide Ratio 4:3
- Color
Keywords
About the Product
This slide utilizes a donut chart to visually analyze business progress. The main colors orange and blue help facilitate clear data comparison while drawing visual attention. It's particularly suitable for conveying critical information about market share or developmental status, effectively delivering corporate performance. The replacement of text and data fields is straightforward, and the overall editing difficulty is moderate, allowing for quick integration into various presentations.
Usage Points
-
Main Usage
- This template serves as an effective tool for presenting business performance metrics during meetings or strategy sessions, allowing stakeholders to grasp insights quickly.
-
How to Use
- It can be utilized in quarterly reviews to illustrate market share trends or in project updates to showcase development milestones, thus facilitating informed decision-making.
-
Recommended For
- Ideal for business analysts, project managers, and team leaders who need to present data-driven insights in a concise and visually engaging manner.
-
Slide Structure
- The layout is designed to guide the audience through a logical progression, starting with an overview of key metrics followed by detailed insights, ensuring clarity in communication.


