Global Map and Distribution Chart – Insights for Market Understanding
RJ0600068_17
- Last Update 07/08/2025
- File Size 4.7MB
- # of Slides 2
- File Format PPTX
- Slide Ratio 16:9
- Color
Keywords
About the Product
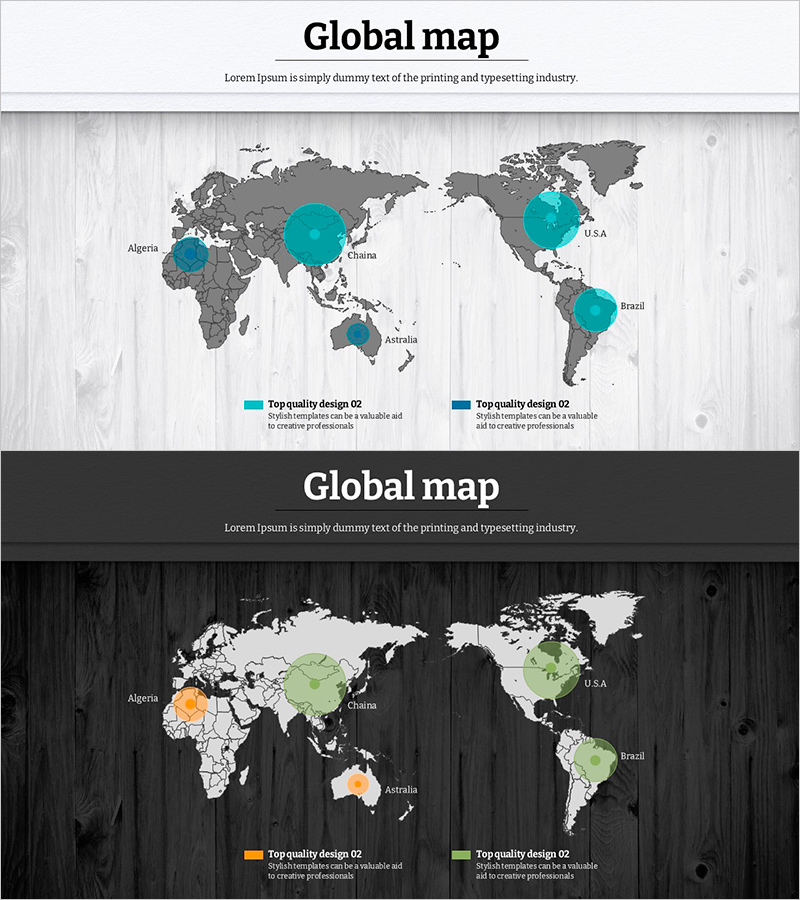
A comprehensive global map PowerPoint slide designed to visualize international market analysis and regional business performance at a glance. This slide deck features two distinct design variations: one with a light wood-grain background and teal bubble markers, and another with a dark wood-grain background using green and orange bubble indicators. Each slide displays a world map with data points for key regions (USA, China, Australia, Brazil, Algeria) represented as proportional circles. The layout includes a title and description area at the top, with a legend at the bottom categorizing two data types. Ideal for business presentations, quarterly reports, and marketing strategy decks where global expansion and regional performance need clear visual communication.
Usage Points
-
Main Usage
Communicate international market conditions, regional business performance, and global strategy execution by visually comparing data across multiple geographic regions. Enables executives, investors, and stakeholders to quickly understand regional distribution, market penetration, and comparative performance metrics in a single visual.
-
How to Use
Enter your analysis topic in the title area (e.g., Global Revenue by Region, Customer Distribution Across Markets). Adjust bubble sizes and colors to match your regional data values. Customize the legend at the bottom to clearly define the two data categories being compared, ensuring audience comprehension of regional relationships.
-
Recommended For
Multinational corporations presenting quarterly or annual business reports, investment pitch decks for global expansion, management consulting firms conducting market research, international marketing teams analyzing regional performance, and enterprise sales organizations tracking geographic market penetration.
-
Slide Structure
Two-slide layout: Slide 1 features light wood background with teal bubbles; Slide 2 uses dark wood background with green and orange bubbles. Each slide contains a title section (single line), central world map with 5 regional data points, and bottom legend with 2 data categories. Information hierarchy is clearly defined with distinct visual zones for title, map, and legend.
Related Products
-

Market Target Setting and Analysis Map – Designing Effective Marketing Strategies
#Market and Competitor Analysis #Marketing Plan and Strategy #Other
-

Effective Visualization Slide for Global Market Revenue
#Company Introduction #Market and Competitor Analysis #Other
-

Target Market Location Icon – Global Market Insights
#Market and Competitor Analysis #Marketing Plan and Strategy #Other
-

Global Market Target Countries Infographic Slide
#Company Introduction #Market and Competitor Analysis #Other
