Asian Market Analysis – Strategic Approach
RJ0600065_16
- Last Update 07/07/2025
- File Size 1.5MB
- # of Slides 2
- File Format PPTX
- Slide Ratio 16:9
- Color
Keywords
- #Content-Based Slides
- #Design-Based Slides
- #Market and Competitor Analysis
- #Marketing Plan and Strategy
- #Other
- #Target Market
- #Target Market Strategy
- #16:9
- #Asia market analysis PowerPoint slide
- #regional map presentation template
- #market analysis geography design
- #Asia target market PPT
- #competitive analysis slide template
About the Product
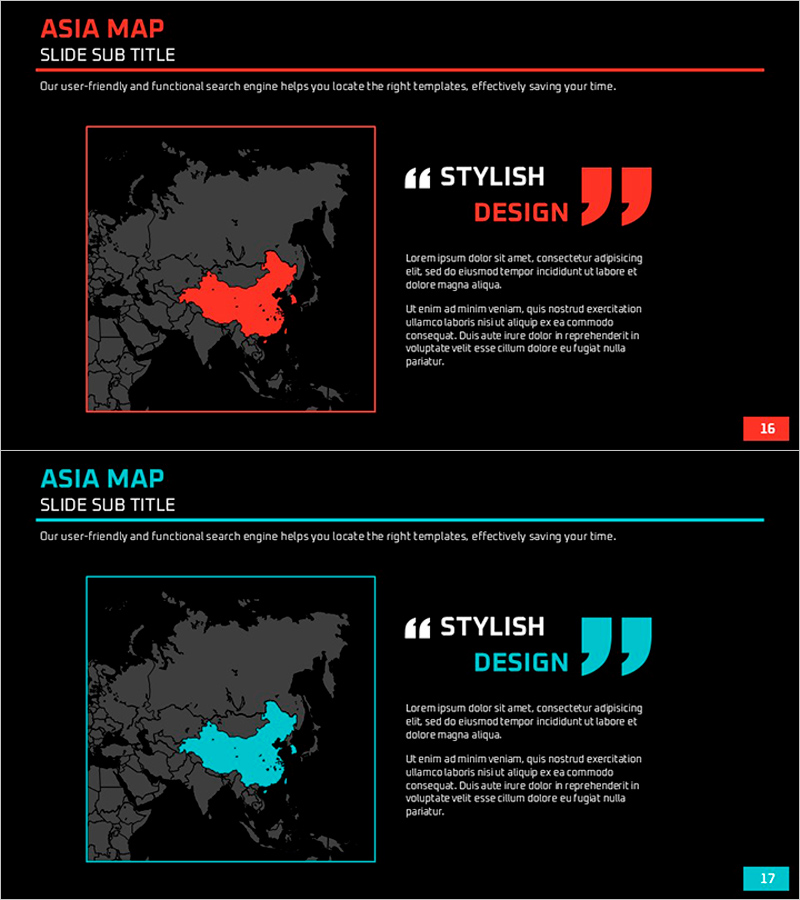
A regional market analysis PowerPoint slide designed for Asia-focused business strategy presentations. The slide features a dark background with red and cyan accent colors highlighting specific Asian countries or regions on a detailed map. The layout combines a left-side geographic visualization with a right-side text area containing title, subtitle, and descriptive paragraphs. This 2-slide deck is ideal for market analysis, competitive landscape assessment, and target market strategy sections in marketing plans, business proposals, and investor pitches. Fully editable PPTX format for immediate customization.
Usage Points
-
Main Usage
Communicate Asia regional market conditions, competitive landscape, and target market strategy through geographic visualization. The map-based design enables clear prioritization of regional expansion strategies to investors, partners, and internal decision-makers.
-
How to Use
Highlight specific countries or regions on the left-side map using red or cyan accent colors. Add market size, growth rates, competitive environment, and market entry strategy details in the right-side text area. Use dual color options to compare regions or illustrate phased expansion plans.
-
Recommended For
Ideal for marketing strategy documents, business proposals, investor pitch decks, and market research reports. Recommended for executives, marketing managers, and strategic planning teams presenting Asia market entry strategies, regional competitive analysis, and target market selection rationale.
-
Slide Structure
Two-slide format with consistent layout: left side features Asia map with country borders and highlighted regions; right side contains title, subtitle, and 3-4 lines of descriptive text. Clear separation between geographic visualization and text input areas enables efficient data entry and customization.
Related Products
-

US Target Area Slide – Market Analysis and Strategy
#Market and Competitor Analysis #Marketing Plan and Strategy #Other
-

Target Market Share Map Graph – Market Analysis and Strategy
#Market and Competitor Analysis #Marketing Plan and Strategy #Graph
-

European Region Survey Pie Chart – Market Analysis and Strategy
#Market and Competitor Analysis #Marketing Plan and Strategy #Graph
-

Target Market VR Market Strategy – Effective Marketing Plan
#Market and Competitor Analysis #Marketing Plan and Strategy #Other
