Diagram of a Soccer Game – Visualizing Team Strategy
RJ0600052_10
- Last Update 07/04/2025
- File Size 0.7MB
- # of Slides 2
- File Format PPTX
- Slide Ratio 16:9
- Color
Keywords
- #Content-Based Slides
- #Design-Based Slides
- #Company Introduction
- #Product/Service Introduction
- #Diagram
- #Organizational Chart
- #Product and Service Overview
- #Structure
- #Spread
- #Tree Diagram
- #16:9
- #soccer diagram PowerPoint
- #team tactics slide template
- #radial diagram PowerPoint
- #sports strategy visualization
- #soccer game analysis presentation
About the Product
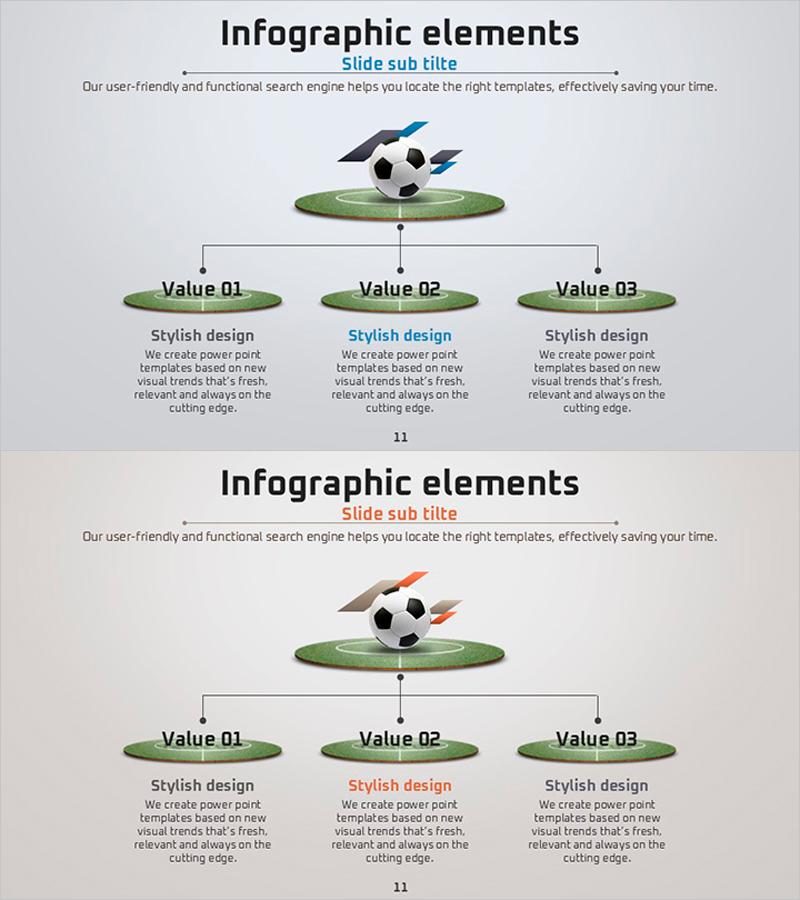
A radial diagram PowerPoint slide that visualizes soccer team tactics and game strategy. Centered on a soccer ball illustration, three tactical points branch outward in a radial pattern, each with dedicated text areas for detailed explanations. The green field background combined with gray and blue accent elements reinforces the professional sports presentation aesthetic. This 2-slide set is ready to use for team strategy presentations, game analysis, tactical briefings, and sports performance reports.
Usage Points
-
Main Usage
Designed to explain sports team tactics, positional roles, and strategic analysis through visual representation. Beyond soccer, it works for other team sports tactics, organizational role distribution, and three-axis strategic frameworks in business and sports contexts.
-
How to Use
Use the central soccer ball illustration as your main topic, then input team tactics, positions, or game strategies into the three radial nodes. Add detailed descriptions in the text areas below each node to complete the tactical structure. All colors and text are fully editable to match your presentation theme.
-
Recommended For
Soccer coaches, sports analysts, team managers, physical education instructors, and sports marketing professionals presenting game tactics, team building initiatives, performance analysis reports, and strategic planning sessions.
-
Slide Structure
2-slide set with radial layout. Each slide features a central soccer ball with three nodes (Value 01, 02, 03) radiating outward, each with text input areas below. Green field background, gray connecting lines, and blue/orange directional arrows emphasize the radial flow and strategic hierarchy.
Related Products
-

A Clear Map of Roles Slide
#Company Introduction #Diagram #Organizational Chart
-

Triple Team Introduction Slide – Overview of Our Team
#Company Introduction #Diagram #Organizational Chart
-

Infographic Slide for Competition Tournaments and Player Arrangements
#Company Introduction #Market and Competitor Analysis #Diagram
-

Molecular Network Organization Chart – Efficient Structure Representation
#Company Introduction #Diagram #Organizational Chart
