Arrow Direction Flow Diagram – Clear Visualization
RJ0600045_6
- Last Update 07/03/2025
- File Size 0.4MB
- # of Slides 2
- File Format PPTX
- Slide Ratio 16:9
- Color
Keywords
About the Product
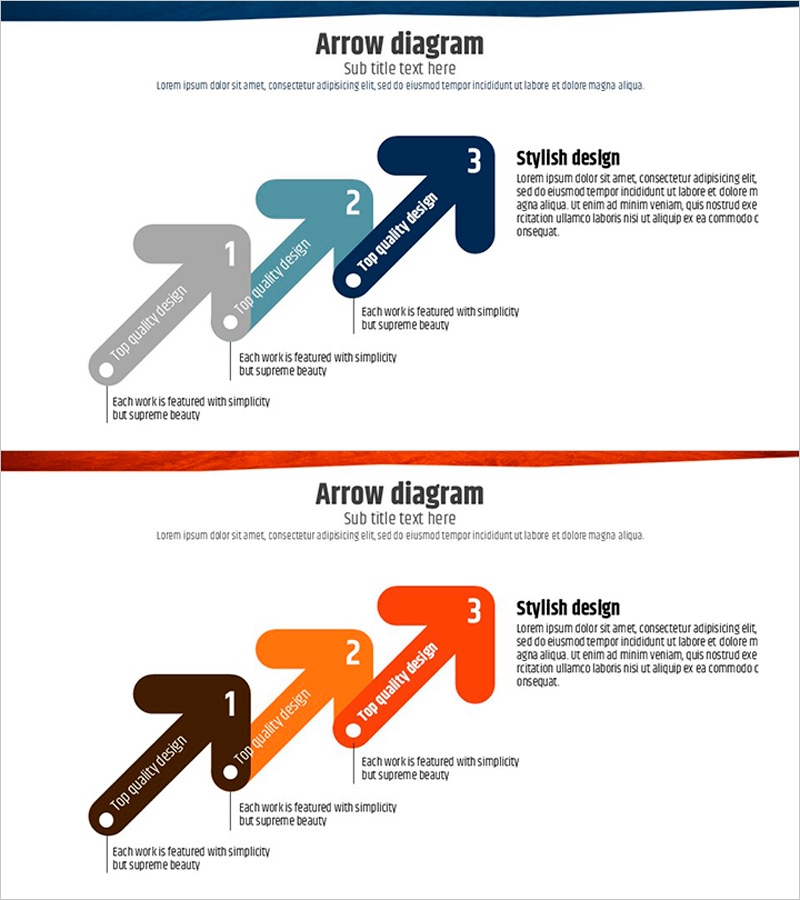
A 3-step arrow flow diagram PowerPoint slide designed to visualize project phases, business processes, and strategic execution sequences. The left-to-right linear flow structure features numbered nodes with dedicated text areas for each stage. The dual-tone color scheme—blue, gray, and orange—clearly differentiates each step, while circular nodes and arrow connectors emphasize process continuity. The 2-slide set includes color variations (blue series and orange series) so you can match your presentation theme and brand colors. Delivered in 16:9 widescreen PPTX format, fully editable and ready to use immediately.
Usage Points
-
Main Usage
Illustrate project phases, business workflows, strategic execution steps, product development cycles, and marketing campaign stages in a sequential manner. Each stage displays key content with arrow connectors, enhancing audience comprehension of the overall process flow.
-
How to Use
Enter the stage title and description in the text boxes next to each numbered node (1, 2, 3). Add transition labels above the arrows (e.g., Plan → Execute → Evaluate) to clarify the process flow. Retain the existing dual-tone color scheme or customize using your presentation theme colors.
-
Recommended For
Ideal for business plans, proposals, and reports when explaining project timelines, execution strategies, and improvement processes. Effective for executives, team leaders, consultants, and marketing professionals presenting step-by-step progress and strategic initiatives.
-
Slide Structure
Comprises 3 circular numbered nodes (1, 2, 3) connected by arrows flowing left to right. Each node is accompanied by a text box for title and description on the right side. Arrow connectors include label areas for stage transitions. Color differentiation (blue, gray, orange) provides clear visual separation between steps.
Related Products
-

Presentation Template - Addictive Design
#Business Strategy #Diagram #Business Direction
-

Aerospace Business Goals Diagram – Business Vision and Strategy
#Business Vision and Strategy #Business Strategy #Diagram
-

Year-by-year Career Page – Roadmap for Business Growth
#Company Introduction #Business Strategy #Diagram
-

Cluster Diagram Template for VR System Goals
#Product/Service Introduction #Business Vision and Strategy #Diagram
