Yearly Analysis Graph – Visualizing Market and Competitor Data
RL0100011_3
- Last Update 01/19/2025
- File Size 1.3MB
- # of Slides 2
- File Format PPTX
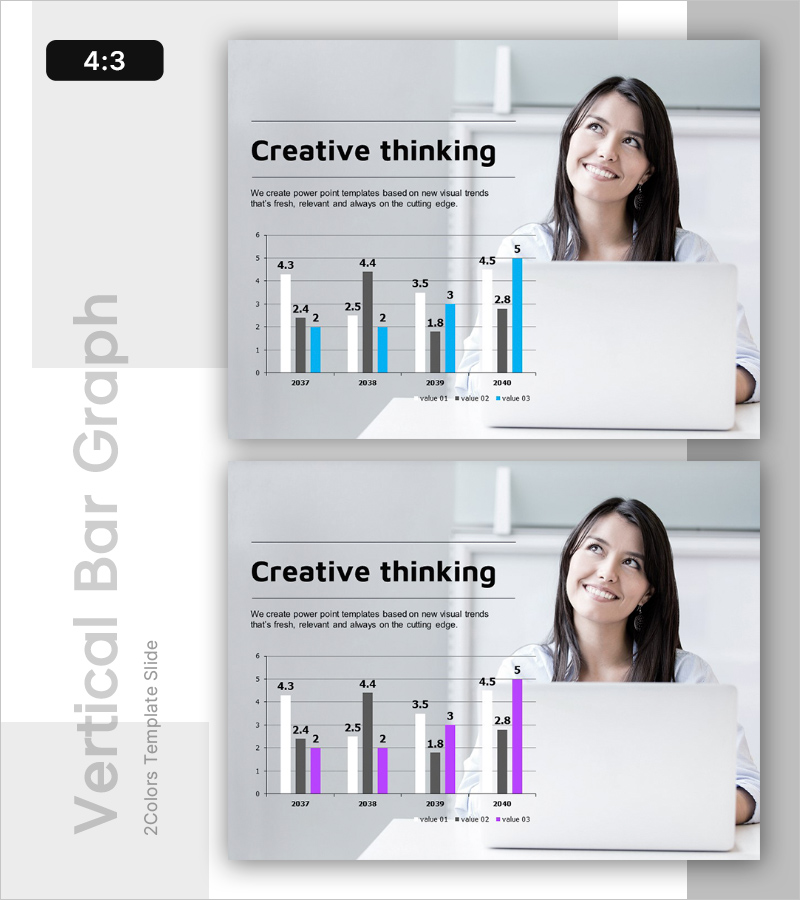
- Slide Ratio 4:3
- Color
Keywords
About the Product
A PowerPoint slide visualizing market and competitor data across four years (2037–2040) using vertical bar charts. Three data series are distinguished by color, with a professional layout featuring a woman's portrait photo and text area on the left side. Ideal for business presentations, annual reports, market analysis sections, and competitive intelligence slides. The 4:3 PPTX format allows immediate editing of all values, labels, and color schemes to match your corporate branding and data requirements.
Usage Points
-
Main Usage
Displays year-over-year market trends, competitive performance metrics, revenue growth, and market share changes using vertical bar charts. Enables stakeholders to quickly compare multi-year data and identify patterns across different business metrics.
-
How to Use
Insert this slide into the market analysis section of business plans, competitive landscape pages in investor pitch decks, or quarterly performance reports. Replace chart values and labels with your actual data, and adjust colors to align with your company's visual identity and presentation theme.
-
Recommended For
Marketing managers, business development teams, financial analysts, and executives presenting strategic insights benefit from this layout. Particularly effective for board meetings, investor presentations, and strategic planning sessions requiring multi-year comparative analysis.
-
Slide Structure
Title area (top left), descriptive text input space (middle left), and vertical bar chart occupying the right side. The chart displays 4 years on the x-axis with 3 data series per year, complete with value labels and color-coded legend for easy interpretation.


