Current Status Analysis Circle Graph
RL0100007_3
- Last Update 08/18/2025
- File Size 1.2MB
- # of Slides 2
- File Format PPTX
- Slide Ratio 4:3
- Color
Keywords
About the Product
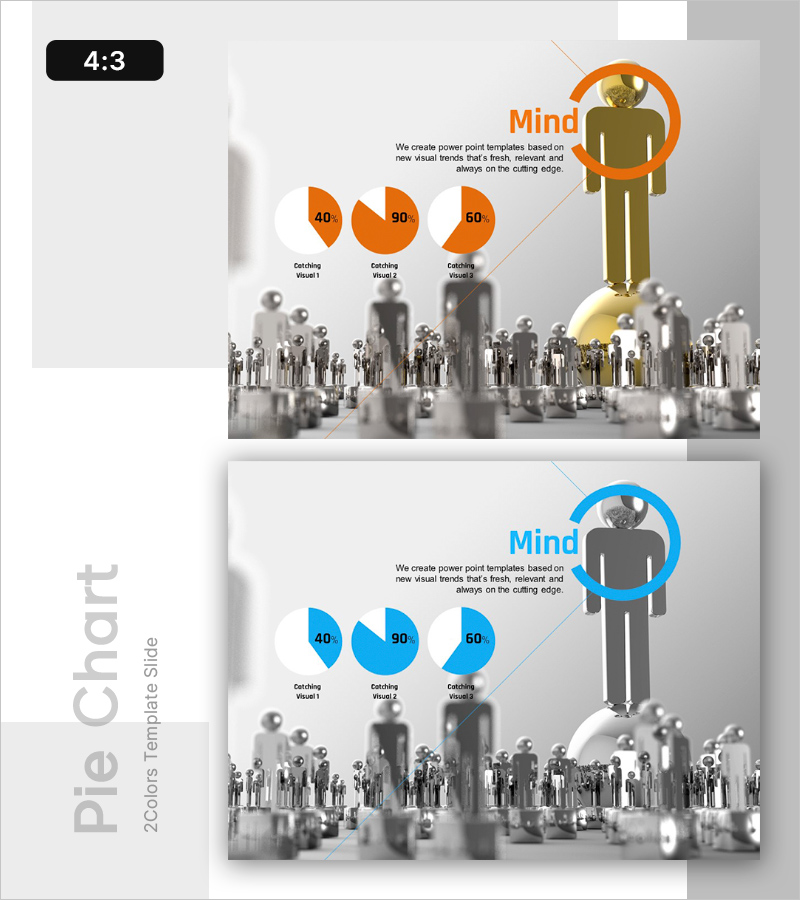
A PowerPoint slide featuring circle graphs to visualize market status and competitive analysis with intuitive data representation. The slide displays three segments showing 40%, 90%, and 60% ratios in pie chart format, available in both orange and blue color versions. The layout combines a text description area on the left with an illustrated figure on the right, enhancing presentation credibility. Composed of 2 slides in 4:3 aspect ratio, fully editable in PPTX format. Ideal for presenting market share, customer satisfaction scores, business performance metrics, and other comparative percentage data in reports and presentations.
Usage Points
-
Main Usage
Visualize three data points with percentage values using pie charts to strengthen presentation impact. Effectively communicate market share, customer satisfaction, and business performance metrics in analysis sections.
-
How to Use
Input percentage values into each pie chart segment and add descriptive text in the left text area. Replace the illustrated figure with company representative or decision-maker imagery as needed. Select color version matching your presentation theme.
-
Recommended For
Recommended for executive reports, investor presentations, and business performance analysis. Suitable for market analysis sections in marketing plans, competitive analysis pages in business proposals, and market share explanations in investor relations materials.
-
Slide Structure
Two-slide composition with left text area (title and 3-line description), center three pie charts (showing 40%, 90%, 60%), and right illustrated figure area. 4:3 aspect ratio optimized for projector environments and standard presentation displays.


