Business Outlook Analysis Graph – Data Visualization for Competitive Enhancement
RL0100005_3
- Last Update 01/18/2025
- File Size 2.1MB
- # of Slides 2
- File Format PPTX
- Slide Ratio 4:3
- Color
Keywords
About the Product
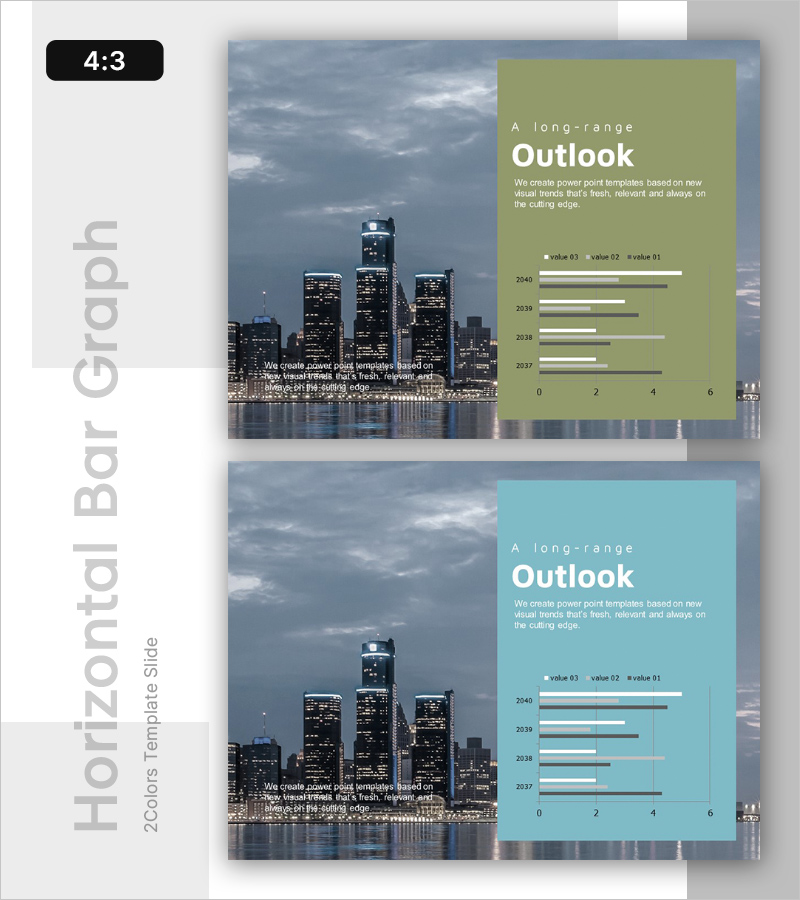
An essential PowerPoint slide for presenting market outlook and future strategy planning. This 4:3 aspect ratio template features 2 slides with two color options: olive green and teal. Each slide combines a cityscape background image on the left with a horizontal bar chart on the right, visualizing market trends from 2037 to 2040 across four years. Clear text areas, legend, and numeric axis enable competitive analysis and data-driven decision-making. Ready to use in business presentations, strategy documents, and investor pitches.
Usage Points
-
Main Usage
Clearly communicate market trends and competitive landscape changes over the next four years using horizontal bar charts, enabling executives and stakeholders to understand market outlook. Supports credible vision presentation and strategic decision-making based on data.
-
How to Use
Integrate into business plans, investor pitch decks, strategic planning presentations, and quarterly performance reports in the market analysis section. Select olive or teal color to match corporate branding, input actual market data, and deploy immediately as presentation material.
-
Recommended For
Executives, business development teams, marketing strategists, investor relations managers, and consultants presenting market analysis findings. Particularly effective when communicating market opportunities and threats during strategic planning phases with visual persuasion.
-
Slide Structure
2-slide template with each slide featuring a cityscape background image on the left, olive or teal colored box on the right containing title, subtitle, and descriptive text, horizontal bar chart with 3 data series across 4 years, legend, and 0-6 numeric axis. Includes 3 editable text areas (title, subtitle, description) and 12 data cells (3 series × 4 years).
Related Products
-

Introducing Positive Future Services – Creative Vision
#Emotional Messages
-

Innovative Idea Template Ending Cover
#Emotional Messages
-

AI Innovation Business Ideas Slide – Creative Visualization
#Emotional Messages
-

Opportunities for Advancement in Life – Vision and Strategy for Success
#Emotional Messages
