Map Showing Countries Carrying Out Environmental Protection Activities – Discover Globally
RJ0600020_14
- Last Update 06/26/2025
- File Size 1.1MB
- # of Slides 2
- File Format PPTX
- Slide Ratio 16:9
- Color
Keywords
About the Product
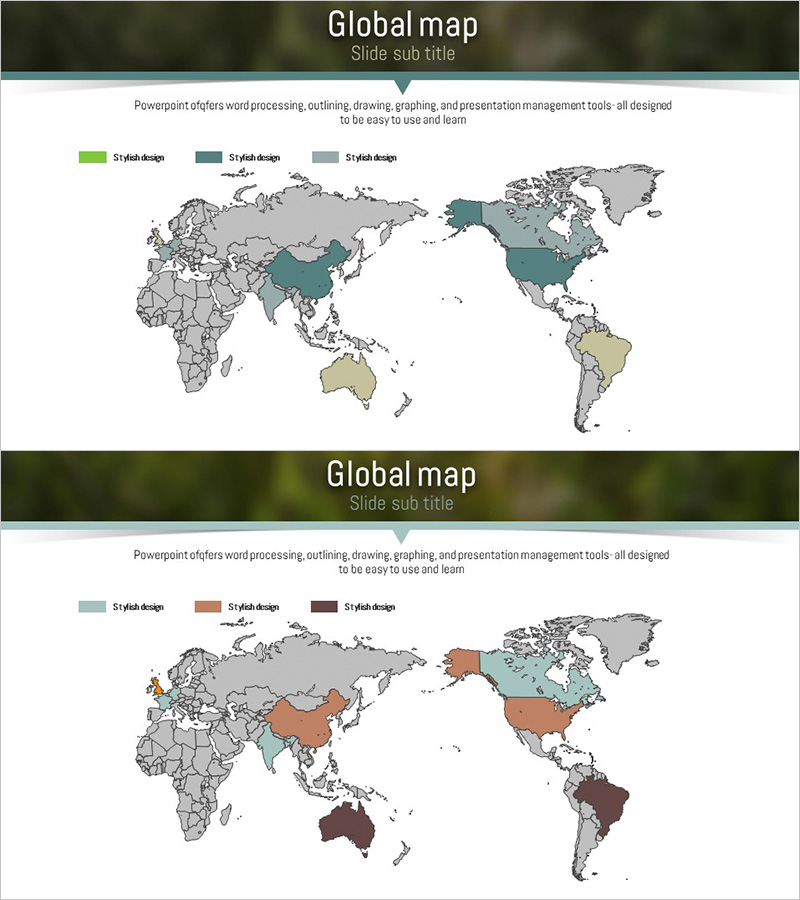
A global map PowerPoint slide that enables instant country-by-country comparison of worldwide data. This 2-slide set features dual color schemes: green, teal, and gray on the first slide, and brown, rust, and black on the second, allowing flexible categorization of multiple data ranges. Each slide includes title and subtitle areas with a legend for clear data interpretation. Perfect for market analysis, environmental reports, and global strategy presentations. Optimized for 16:9 widescreen format across all presentation platforms.
Usage Points
-
Main Usage
Visualize country-level performance, distribution, and status through geographic mapping to enhance audience comprehension in global strategy, market analysis, and environmental reports. Color-coded legends transform complex datasets into intuitive visuals that support executive decision-making.
-
How to Use
Edit the legend text and country colors to match your dataset. Use the first slide for three-category comparisons and the second for alternative color schemes representing different data dimensions. Simply update the title and subtitle areas with your presentation topic to complete the slide.
-
Recommended For
Executives, marketing teams, and policy professionals presenting global business strategy, market entry plans, environmental initiatives, and international partnerships. Ideal for consulting, research, and academic presentations requiring country-level comparative analysis.
-
Slide Structure
2-slide composition. Each slide contains a title and subtitle area at the top (2 lines), a central world map with country-level color differentiation, and a legend with 3 data categories at the bottom. First slide uses green, teal, and gray; second uses brown, rust, and black for flexible multi-category data representation.
Related Products
-

Visualizing Global Target Market – Effective Information Delivery
#Company Introduction #Market and Competitor Analysis #Other
-

Effective Slide Template for Global Financial Services
#Company Introduction #Market and Competitor Analysis #Other
-

User Usage Status by Target Country – Market Analysis and Insights
#Market and Competitor Analysis #Diagram #Other
-

Market Target Setting and Analysis Map – Designing Effective Marketing Strategies
#Market and Competitor Analysis #Marketing Plan and Strategy #Other
