Analysis Graph for Successful Positioning
RL0100003_4
- Last Update 01/18/2025
- File Size 1.8MB
- # of Slides 2
- File Format PPTX
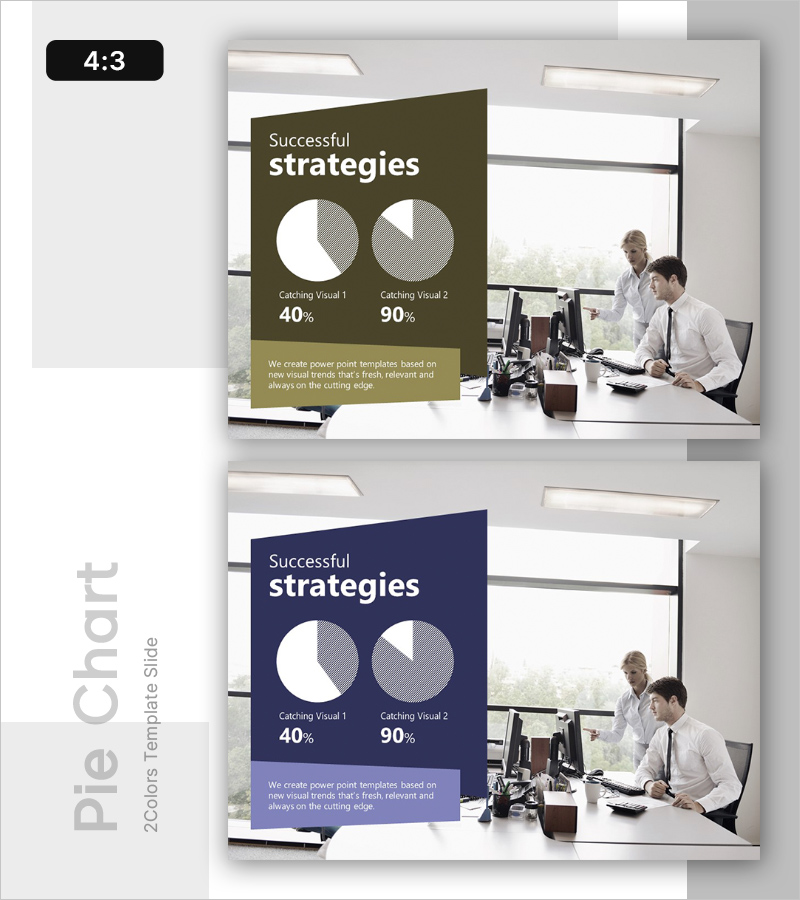
- Slide Ratio 4:3
- Color
Keywords
About the Product
A professional PowerPoint slide designed for marketing strategy presentations and competitive analysis reports. Available in two color schemes—olive green and navy blue—each slide features two pie charts that visually compare success metrics and performance indicators. The layout includes a title section at the top and descriptive text space at the bottom, allowing you to clearly communicate positioning strategies, market analysis, and competitive advantages. This 4:3 ratio, 2-slide set is ready to use immediately in your presentations.
Usage Points
-
Main Usage
This slide supports data-driven decision-making during marketing strategy development by visually comparing your company's strengths against competitors. The dual pie charts enable intuitive understanding of metric ratios, helping executives and team members grasp key insights at a glance.
-
How to Use
Enter your analysis topic in the title area (e.g., market share, customer satisfaction, brand awareness), then replace the pie chart values with your actual data. Complete the slide by adding strategic insights and conclusions in the descriptive text section below.
-
Recommended For
Marketing managers, strategy planning teams, and sales executives can use this slide for quarterly and annual performance reviews, new business proposals, and competitive strategy presentations. It's particularly effective when comparing two key metrics simultaneously.
-
Slide Structure
Each slide contains a title input area at the top, two editable pie charts in the center (with customizable percentage values), and a descriptive text section at the bottom. The olive green version conveys analytical credibility, while the navy version emphasizes professional expertise.


