Farm Business Outlook and Expected Effects Diagram
RJ0600019_11
- Last Update 06/25/2025
- File Size 0.3MB
- # of Slides 2
- File Format PPTX
- Slide Ratio 16:9
- Color
Keywords
About the Product
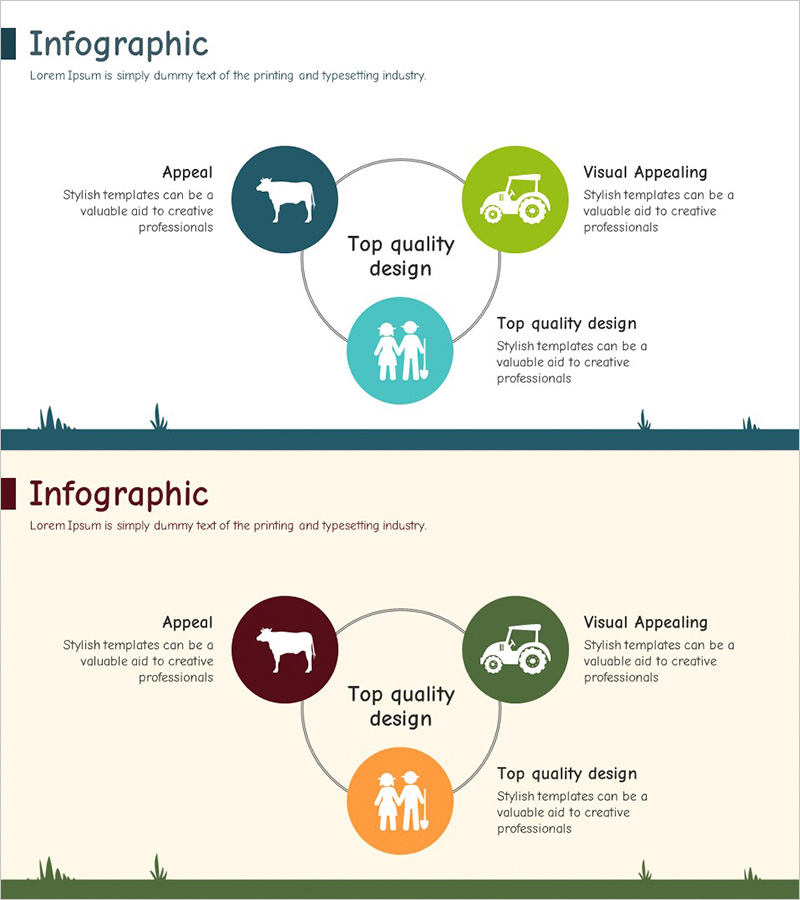
A radial diagram PowerPoint slide that organizes business outlook and expected effects into three core elements connected to a central concept. The design features a central node surrounded by three satellite nodes positioned at left, right, and top, all connected by circular lines. Each node contains an icon and descriptive text, with color-coded circles in navy blue, lime green, and turquoise for visual emphasis. This two-slide set includes a color variation, allowing you to match your presentation's tone. Ideal for business strategy presentations, organizational structure explanations, service implementation plans, and agricultural business communications.
Usage Points
-
Main Usage
Designed to express three key elements in relation to a central concept, such as business strategy, management plans, organizational structure, or service implementation. Emphasizes the main message at the center while visually conveying the interconnectedness of surrounding elements.
-
How to Use
Enter your core concept (e.g., business goal, strategy, vision) in the central text box. Add detailed content in the three satellite nodes (e.g., expected effects, implementation methods, technical aspects). Customize the icons in each node to match your presentation topic and audience.
-
Recommended For
Recommended for agricultural business presentations, business strategy reports, organizational structure explanations, service execution plans, technology sector introductions, and business performance reports. Highly effective for presentations to executives, investors, and team members.
-
Slide Structure
Two-slide set with identical layouts: one central node (circular, editable text area) surrounded by three satellite nodes (circular, icon + text) positioned at left, right, and top. First slide uses navy blue, lime green, and turquoise; second slide features dark red, olive green, and orange for color variation.
Related Products
-

Circular Diffusion Infographic – Visualization of Business Strategy
#Business Vision and Strategy #Technical Approach #Diagram
-

Unified Structure with Central Focus
#Technical Approach #Diagram #Service Operation Plan
-

Triangular Connection Diffusion Diagram – Clear Presentation of Services
#Technical Approach #Diagram #Service Operation Plan
-

Diagram Slide Visualizing Characteristics of Sofa Types
#Product/Service Introduction #Technical Approach #Diagram
