Ribbon PowerPoint Template – Design for Seamless Flow
N0100020
- Last Update 08/28/2025
- File Size 2.5MB
- # of Slides 20
- File Format PPTX
- Slide Ratio 4:3
- Color
Slide Preview
Keywords
About the Product
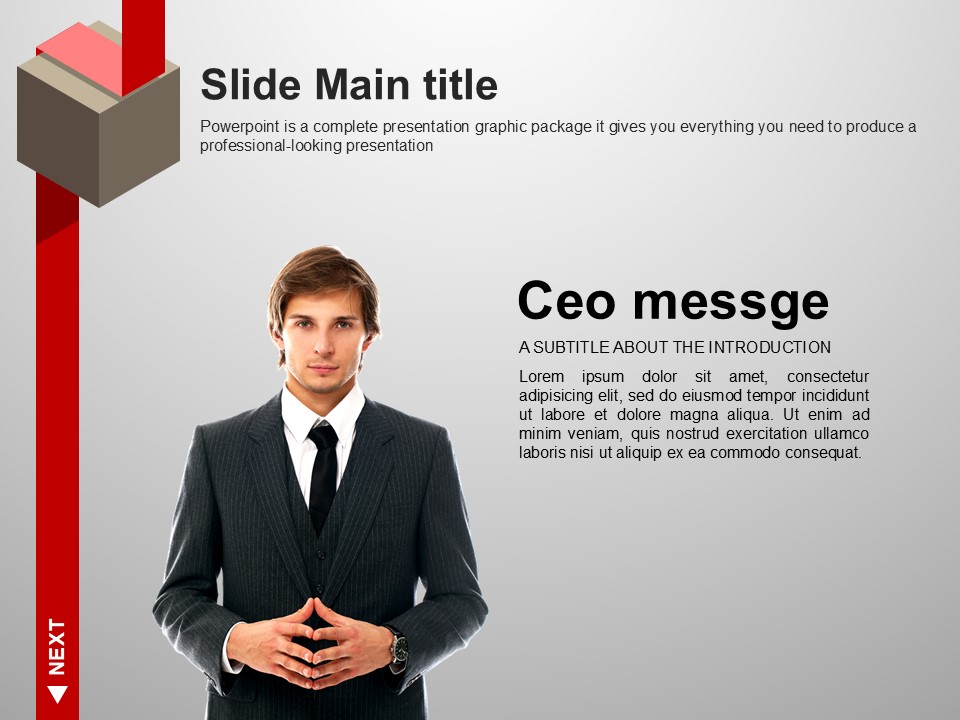
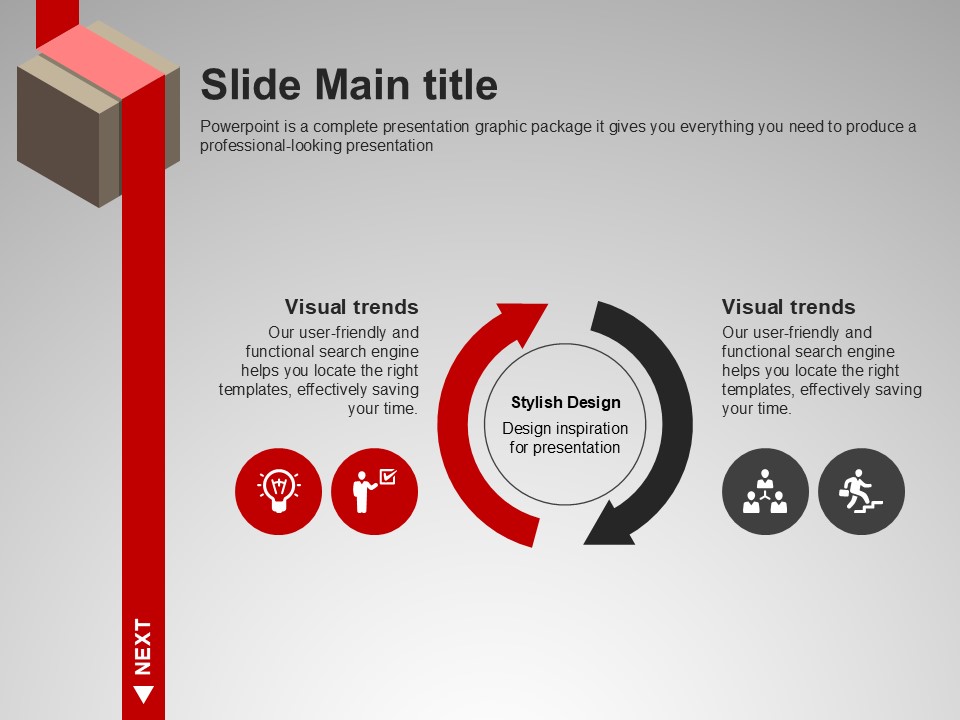
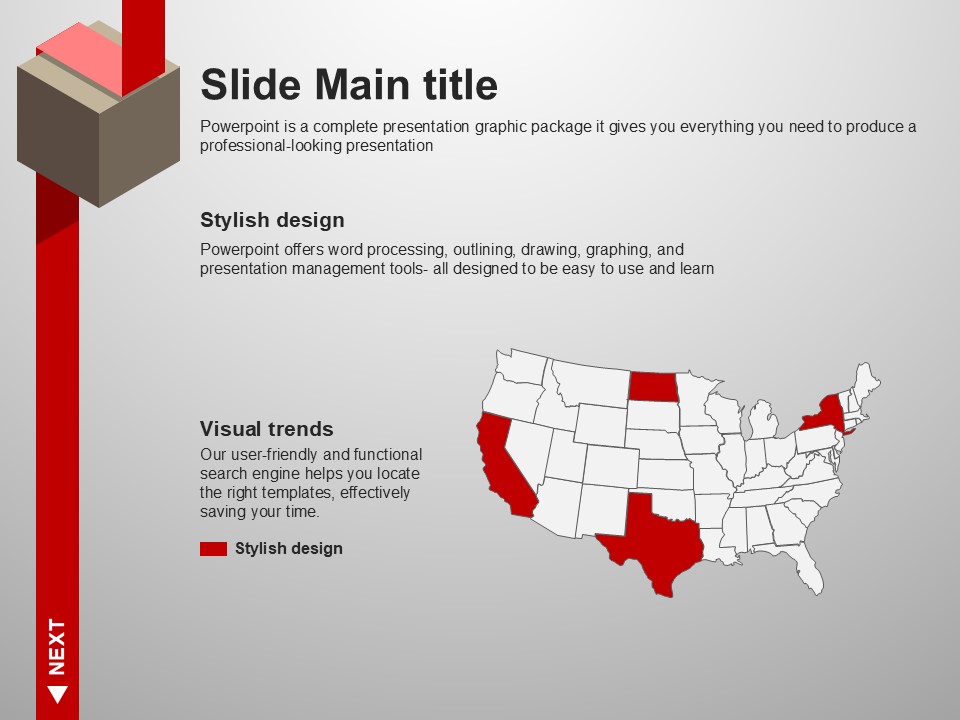
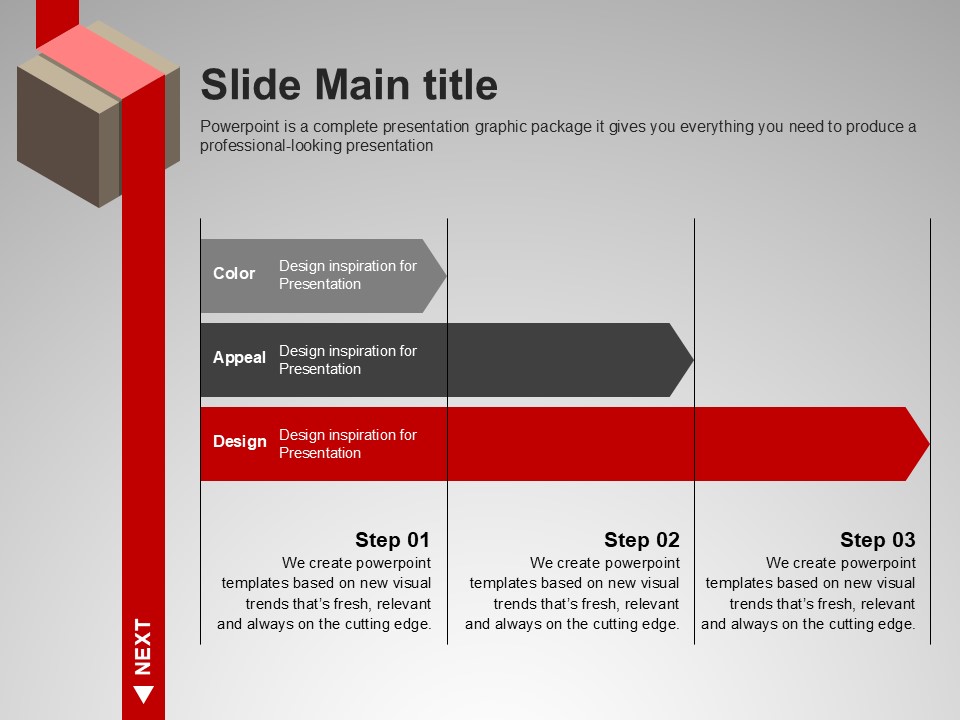
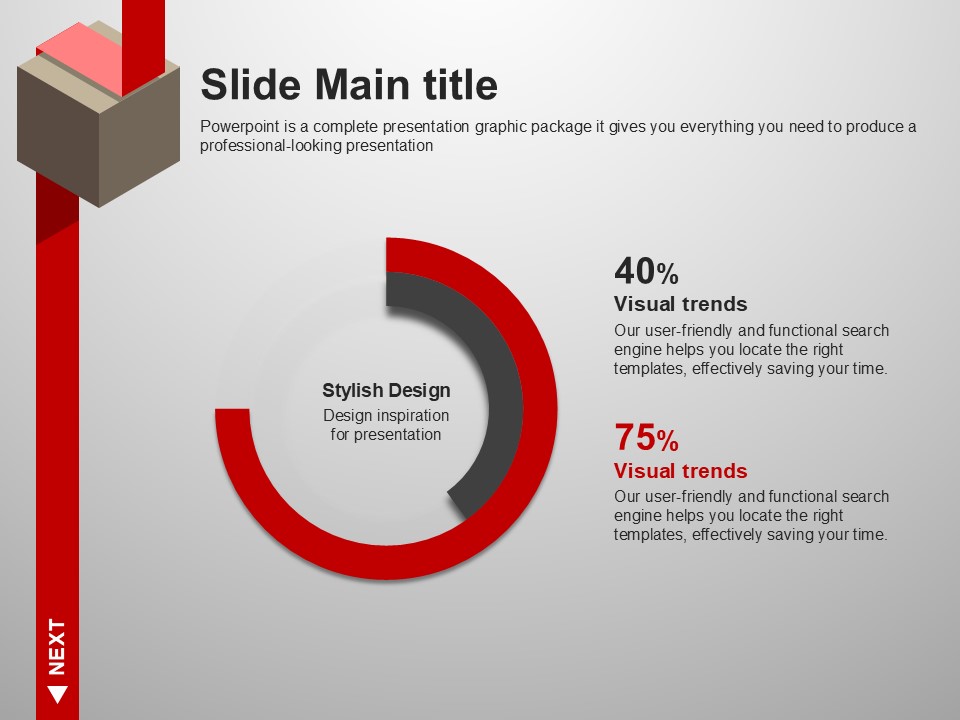
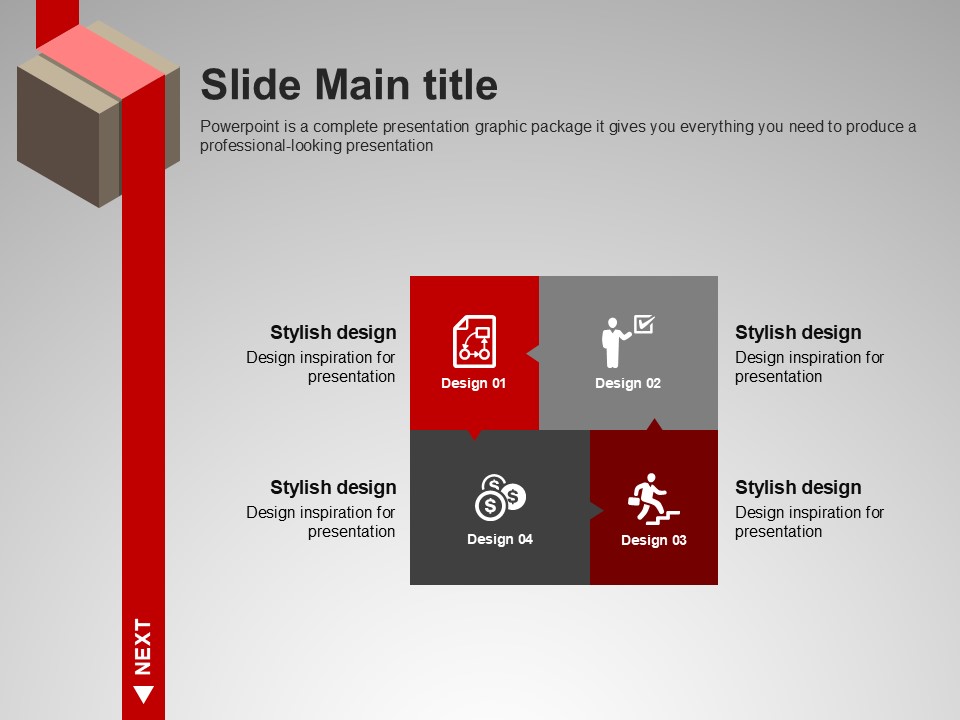
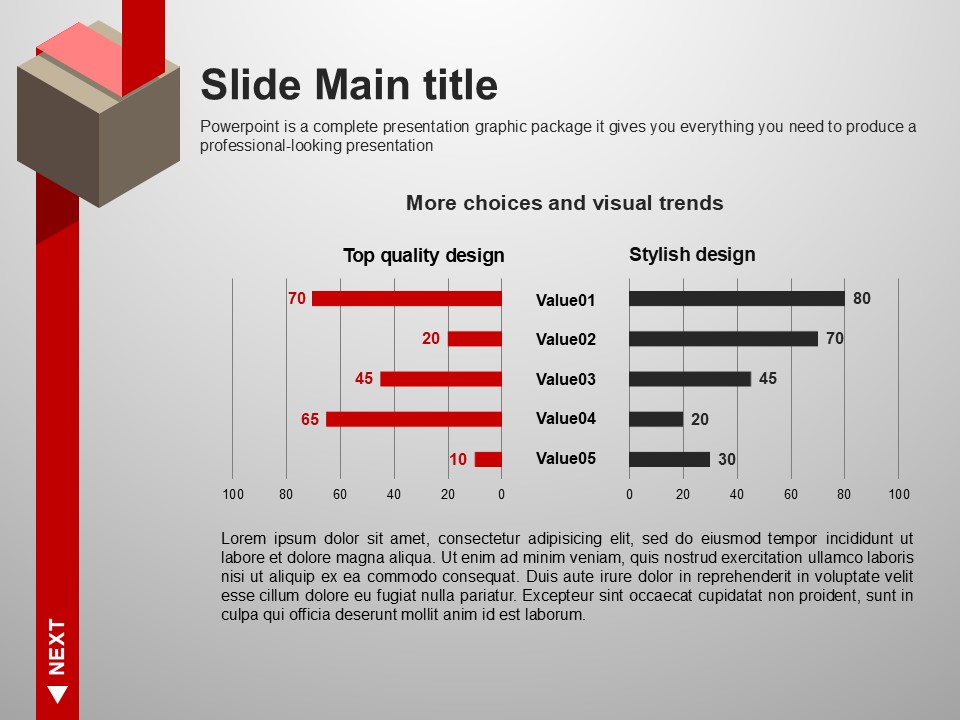
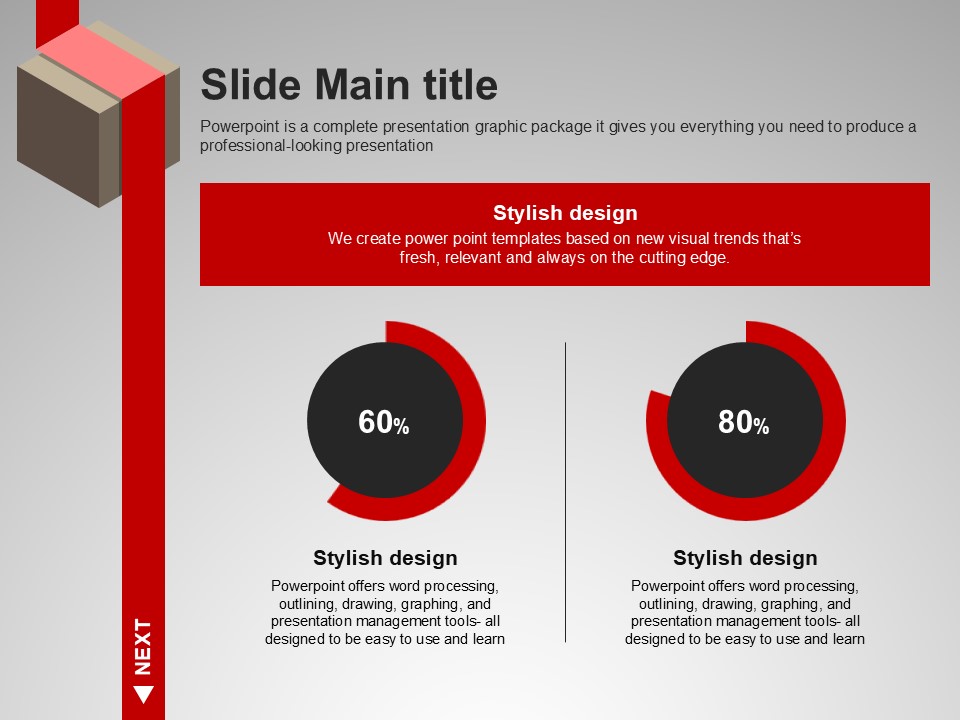
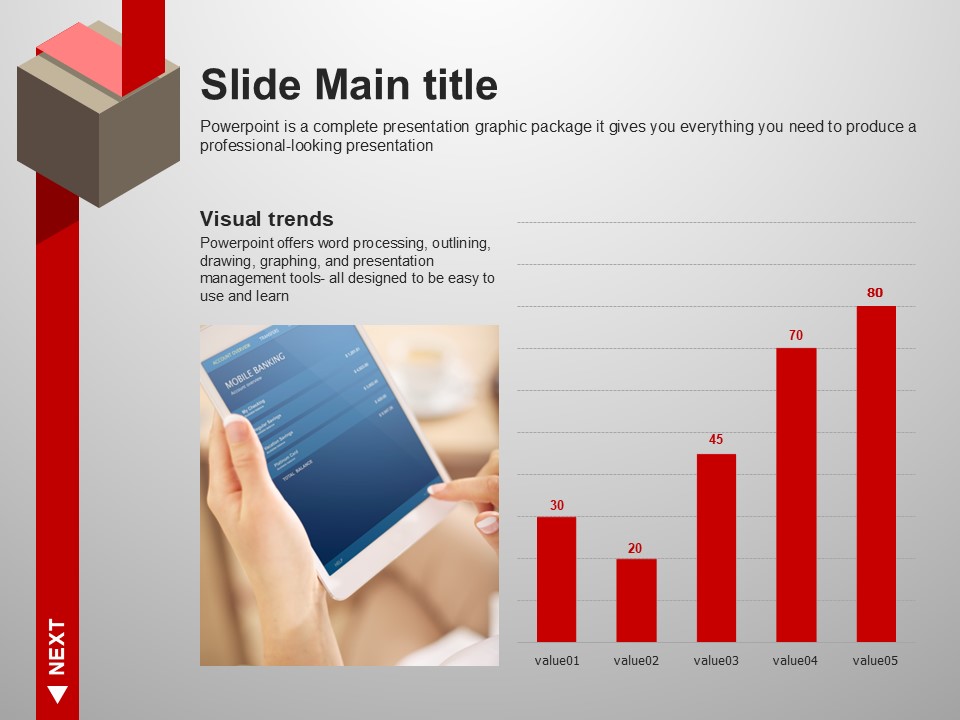
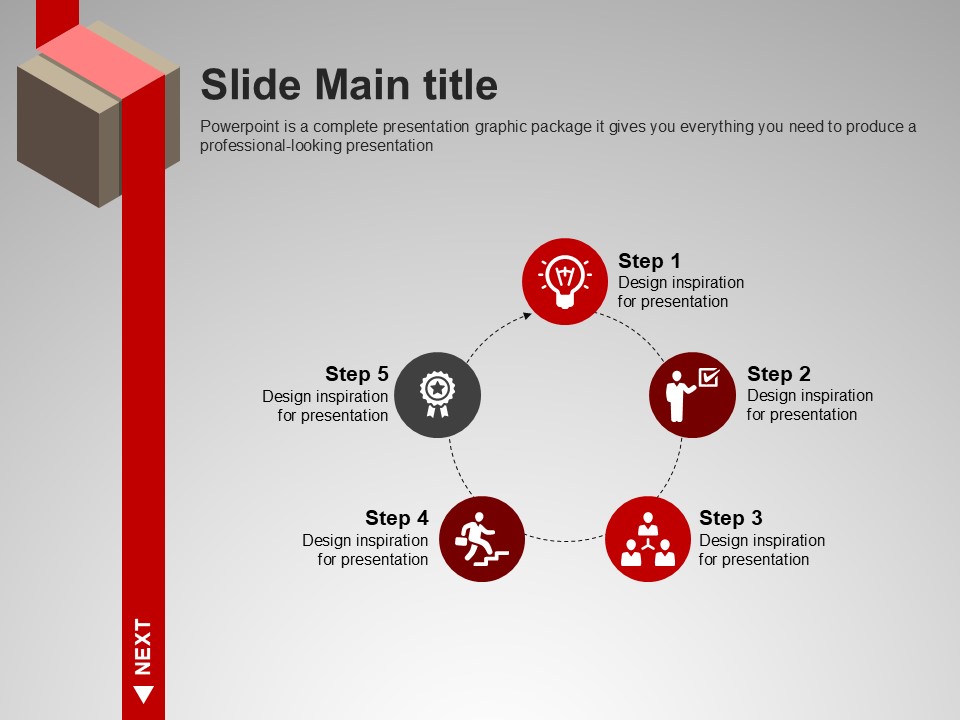
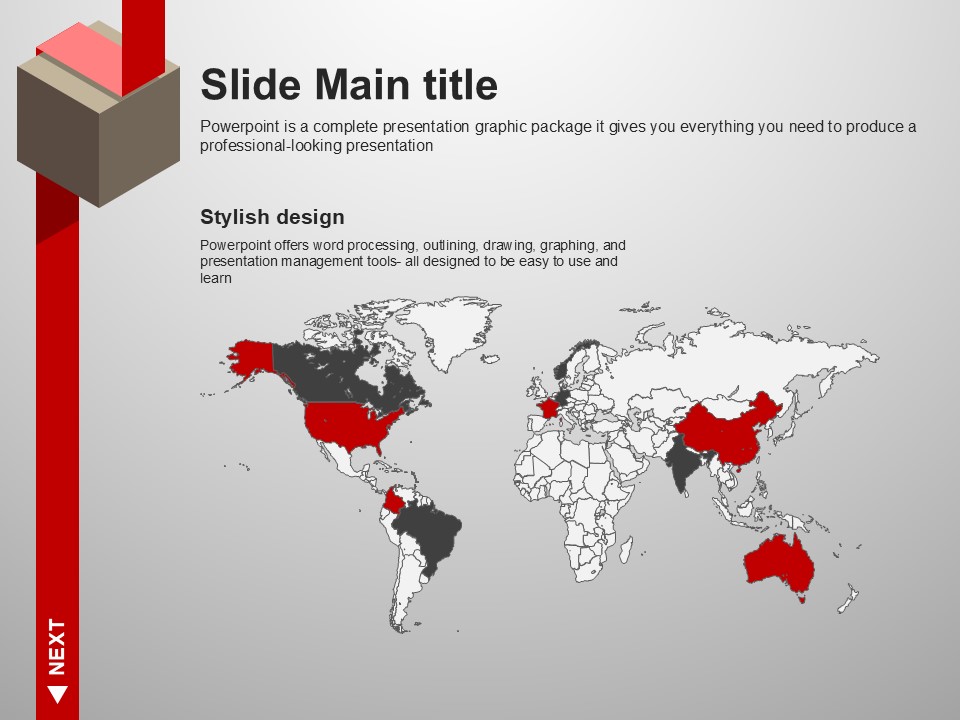
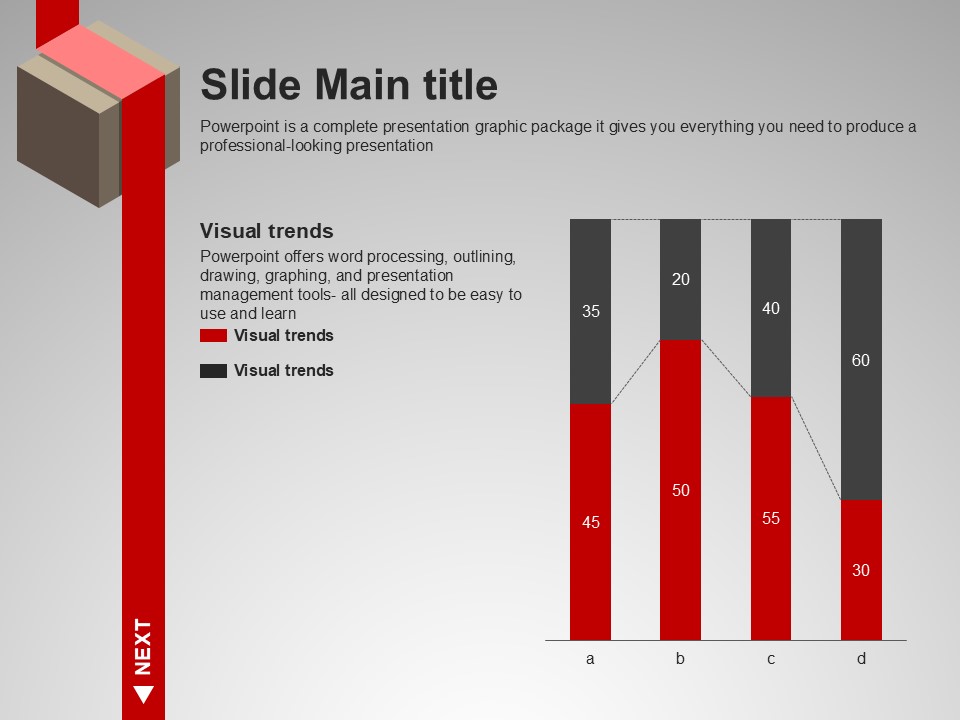
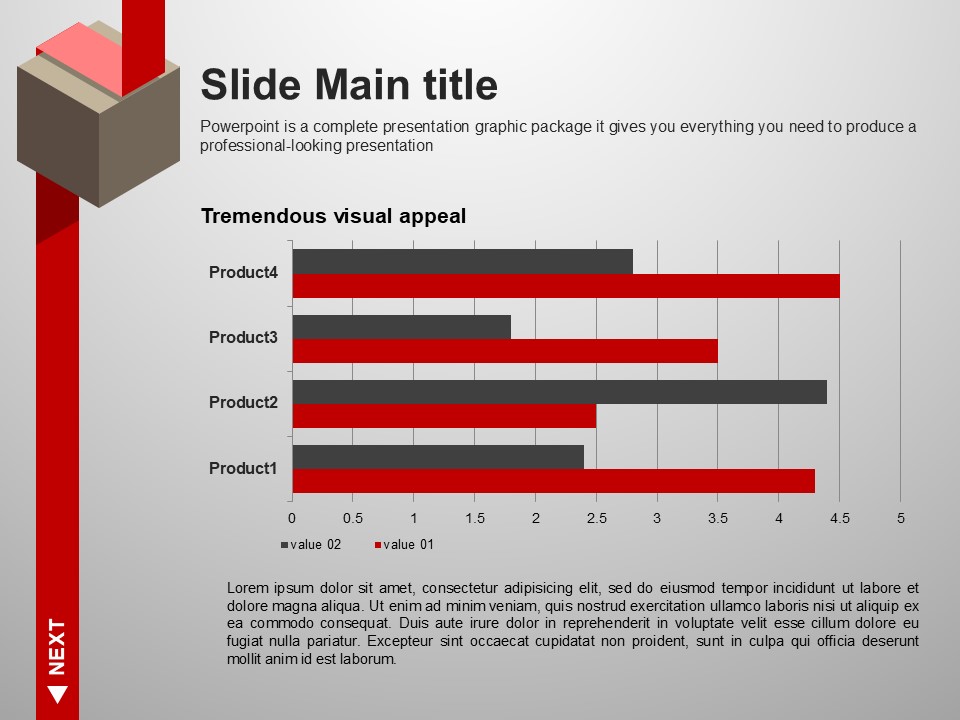
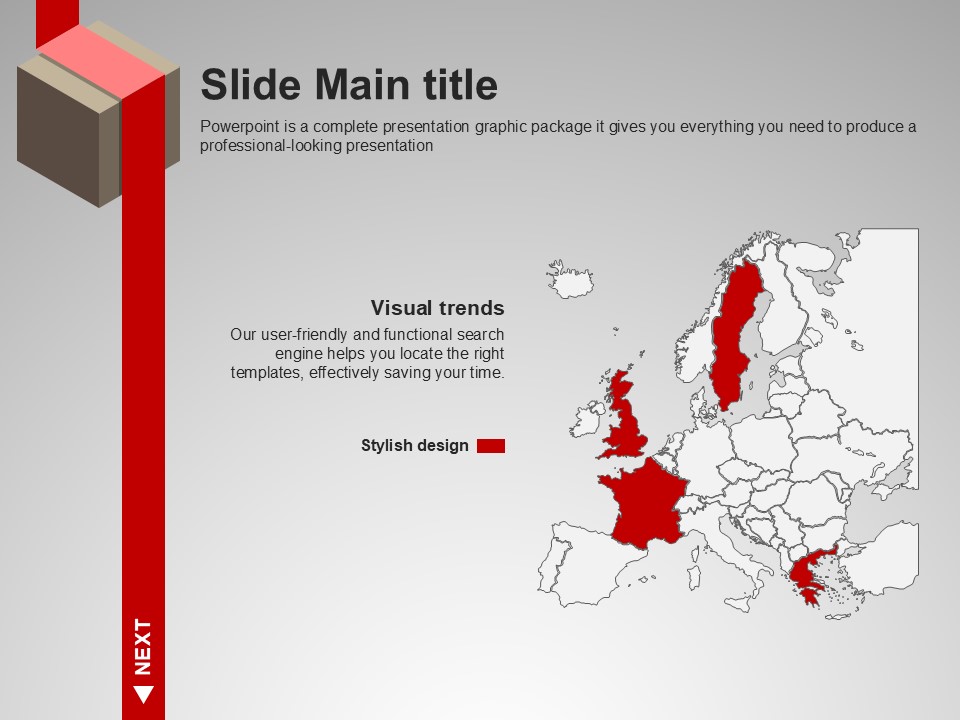
This Moving-style PowerPoint template features a bold red ribbon line running vertically through every slide, paired with a 3D isometric cube object that creates a strong sense of motion and visual momentum. Built on a restrained three-color palette of red, gray, and brown, the design delivers high visual impact without overwhelming the audience. The 20-slide set includes a cover slide, cluster diagram, four-step process flow, donut charts, bar graphs, and image-plus-chart hybrid slides — all unified by the consistent ribbon structure. The template is provided in PPTX format, allowing full editing of text, colors, and chart data directly in PowerPoint. The 4:3 ratio ensures optimal display on legacy projectors and standard screens. Ideal for corporate strategy presentations, business performance reports, and pitch decks where a distinctive visual identity is essential to stand out from conventional slides.
Usage Points
-
Main Usage
Designed for corporate strategy presentations, business performance reports, and pitch decks where strong visual impact is required to capture audience attention and differentiate from standard slide decks.
-
How to Use
Start by entering your presentation title on the cover slide, then arrange the diagram, chart, and hybrid slides to match your narrative flow. Use the red banner text boxes to highlight key messages and replace chart data with your own figures directly in PowerPoint.
-
Recommended For
Best suited for strategy planners, marketing managers, and sales professionals preparing high-stakes corporate presentations, startup founders building investor pitch decks, and consultants who need a visually distinctive proposal template.
-
Slide Structure
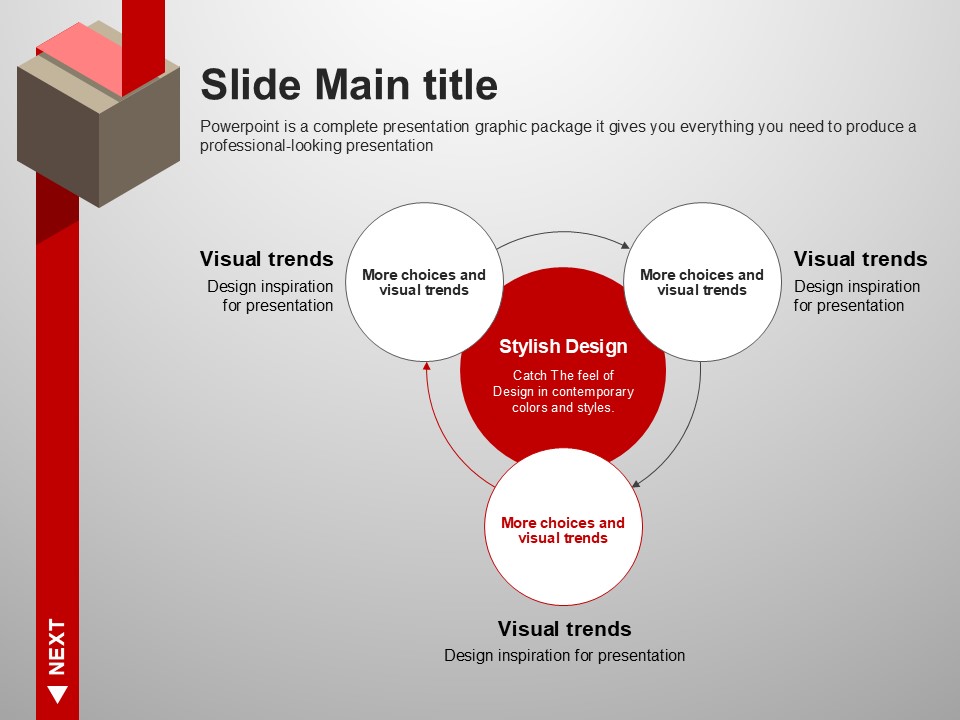
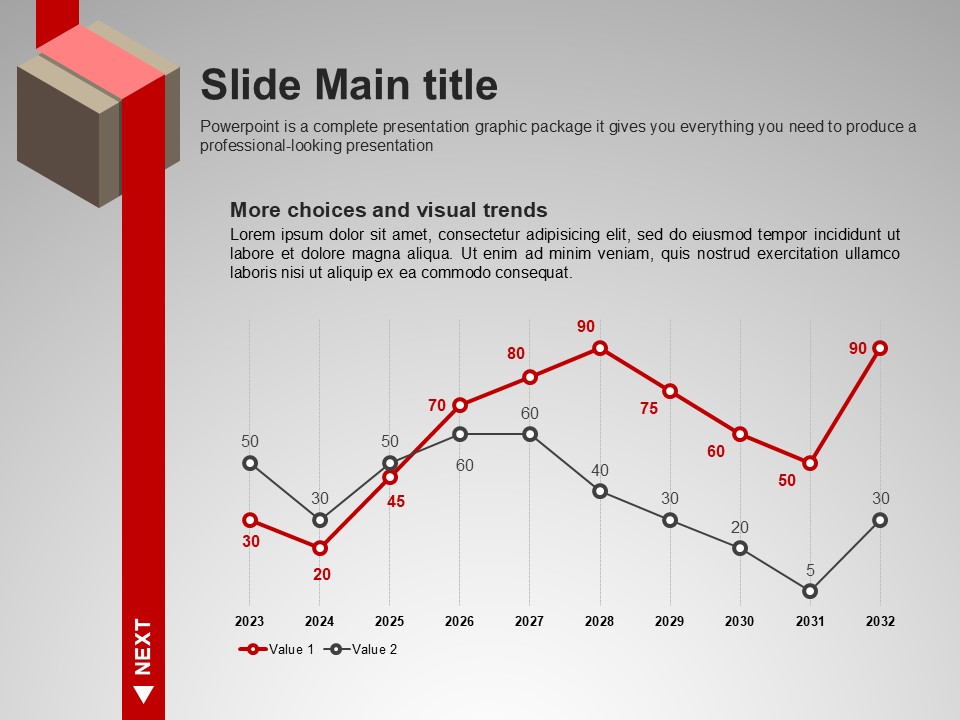
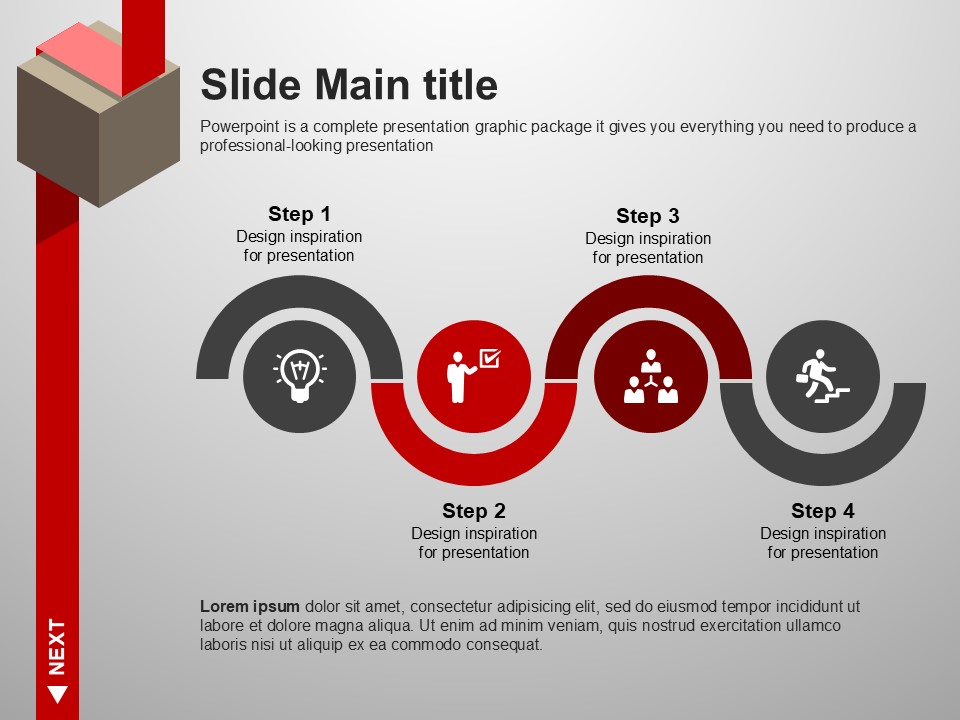
The 20-slide set includes a 3D cube cover slide, red banner emphasis slide, Venn-style cluster diagram, four-step process flow, dual donut charts (60% and 80%), vertical bar graph with photo integration, and image-plus-chart hybrid slides — all unified by the vertical red ribbon motif.


