First Step to Enhance Financial Management – First Finance Guide Template
RJ0500051_3
- Last Update 06/21/2025
- File Size 1.5MB
- # of Slides 4
- File Format PPTX
- Slide Ratio 16:9
- Color
Keywords
About the Product
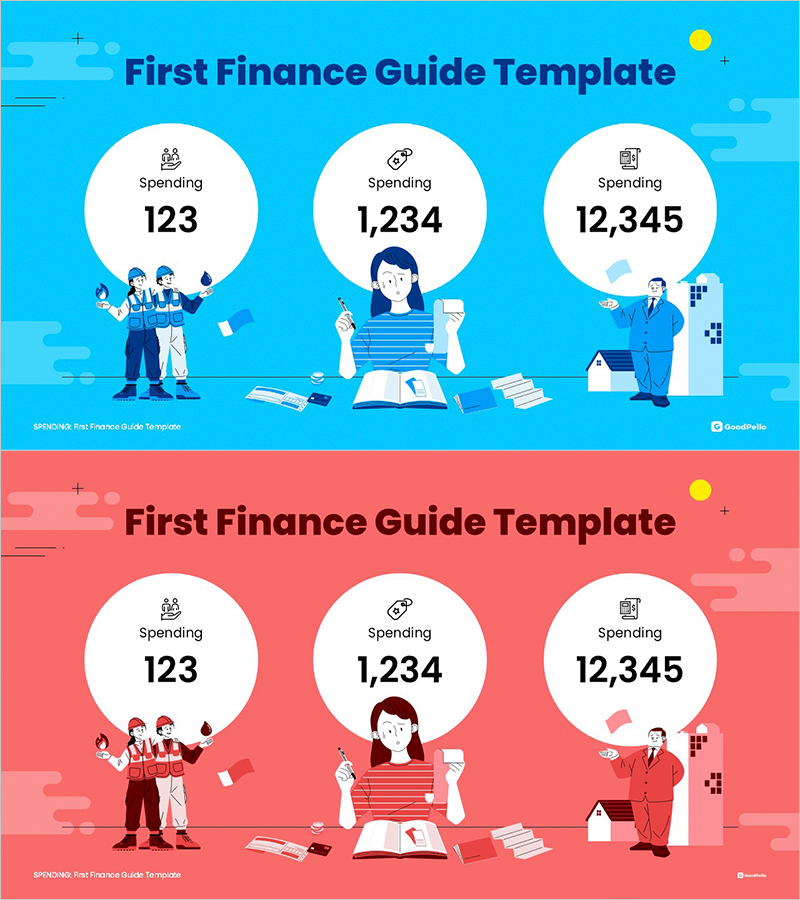
A financial analysis PowerPoint slide designed to visualize spending patterns and cost structures across three expense tiers. Available in two color schemes—bright blue and warm red—this slide presents spending data (123, 1,234, 12,345) through circular charts paired with illustrative icons representing different organizational levels. The layout clearly separates data input areas from numerical displays, making it ideal for financial presentations. Perfect for company profiles, business plans, and investor pitch decks where transparent cost breakdown is essential.
Usage Points
-
Main Usage
This slide effectively communicates organizational spending across three distinct cost levels, from small to large expenditures. It serves as a visual foundation for discussing cost management efficiency, budget allocation strategies, and financial transparency in investor or stakeholder presentations.
-
How to Use
Insert this slide in the financial overview section of company presentations, budget planning segments of business proposals, or cost structure explanations in investor decks. Replace the sample figures with actual spending amounts and add category labels (payroll, operations, capital investment, etc.) in the text areas below each chart.
-
Recommended For
CFOs, finance managers, and executives presenting cost structures; startups explaining budget allocation to investors; department heads reporting spending status to teams. Particularly valuable in finance, consulting, manufacturing, and insurance sectors where financial transparency is critical.
-
Slide Structure
The slide features a title area at the top, three circular chart sections in the center (each with icon, numerical value, and label fields), and an illustration zone at the bottom. The three illustrations represent different organizational spending contexts: team collaboration (left), individual management (center), and organizational oversight (right).
Related Products
-

Introduction to IT Financial Services Business – Innovation and Stability
#Product/Service Introduction #Product/Service Introduction #Product and Service Overview
-

Computer System Services Overview – Value of Top Quality Design
#Product/Service Introduction #Other #Product/Service Introduction
-

Card Company Service Background Description – Visual Trends for Services
#Product/Service Introduction #Product/Service Introduction #Product and Service Overview
-

Shoe Product Introduction Mockup – Captivating Design for Customers
#Product/Service Introduction #Other #Product/Service Introduction
