The Process of Thinking and Success – Visualizing Business Progress
RJ0500039_27
- Last Update 06/17/2025
- File Size 0.5MB
- # of Slides 2
- File Format PPTX
- Slide Ratio 16:9
- Color
Keywords
- #Content-Based Slides
- #Design-Based Slides
- #Business Strategy
- #Text Box
- #Step-by-Step Schedule Plan
- #Arrow
- #Project Progress
- #16:9
- #business progress timeline PowerPoint slide
- #3-stage process flow presentation
- #arrow diagram PowerPoint template
- #how to visualize business execution in PowerPoint
- #phased implementation slide
About the Product
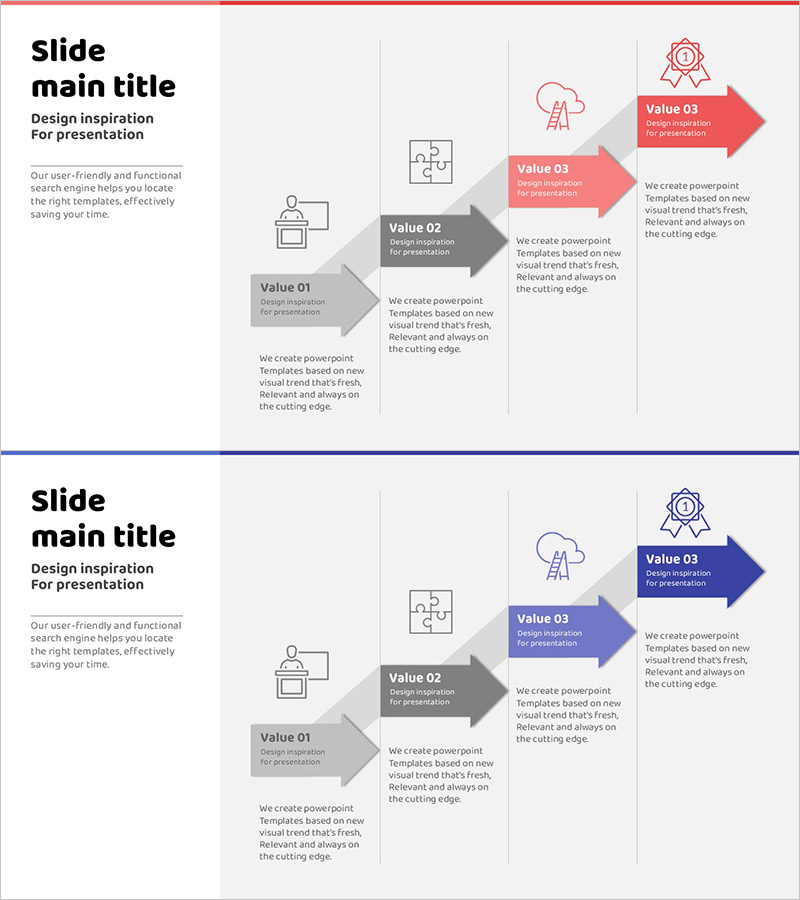
A PowerPoint slide that visualizes business execution progress through a sequential three-stage arrow structure flowing from left to right. Each stage (Value 01, 02, 03) is clearly marked with gray and coral-pink arrow boxes, accompanied by descriptive text and supporting icons. This 2-slide presentation template uses a horizontal timeline layout to effectively communicate business strategy, phased implementation schedules, and success processes. All text boxes and arrow shapes are fully editable, allowing you to customize the content and colors to match your specific presentation needs and corporate branding.
Usage Points
-
Main Usage
Designed to communicate business execution phases and key achievements at each stage through visual clarity. The left-to-right arrow flow intuitively represents temporal progression and sequential milestones, enhancing audience comprehension of complex business timelines and strategic roadmaps.
-
How to Use
Insert this slide into business plans, investor pitch decks, or executive progress reports in the 'Implementation Strategy' or 'Execution Timeline' section. Customize the text boxes and arrow colors to represent 3 or more process stages, adapting the template to your specific project phases and deliverables.
-
Recommended For
Business managers, project leads, and executives presenting progress updates to investors, board members, and stakeholders. Ideal for new business initiatives, product development roadmaps, organizational transformation projects, and quarterly business reviews requiring clear phase-by-phase communication.
-
Slide Structure
Two-slide layout with left-aligned title area and right-aligned timeline section. The timeline features three sequential arrow boxes with value labels and supporting text fields, complemented by icons and color coding to distinguish each phase and enhance visual hierarchy.
Related Products
-

Linear Diagram of Business Step-by-Step Plan – Essential Template for Achieving Business Goals
#Business Strategy #Diagram #Text Box
-

How to Use Matcha Powder – Premium Diagram Slide
#Business Strategy #Step-by-Step Schedule Plan #Project Progress
-

Propulsion Stage Diagram – Clearly Define Business Direction
#Business Strategy #Diagram #Text Box
-

Visual Diagram of Criminal Proceedings Step-by-Step
#Business Strategy #Diagram #Step-by-Step Schedule Plan
