Silhouette and Arrow Changes – A Glimpse into Marketing Strategy
RJ0500024_12
- Last Update 06/13/2025
- File Size 1.8MB
- # of Slides 2
- File Format PPTX
- Slide Ratio 16:9
- Color
Keywords
About the Product
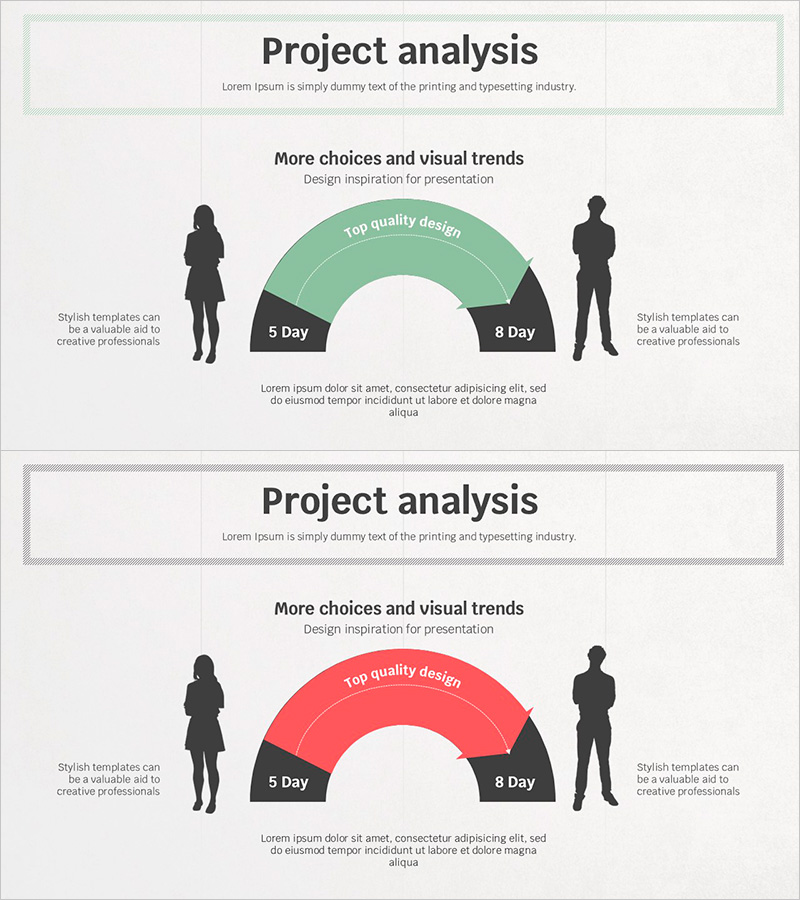
A PowerPoint slide that visually compares project progress across different time periods using a two-tone arc chart design. The layout features silhouette figures on both sides with a central arc chart in green and red tones, comparing metrics over 5-day and 8-day periods. This presentation slide is ideal for marketing strategy presentations, project evaluations, and performance analysis reports. The 16:9 PPTX format with 2-slide structure provides clear separation between text and chart areas, making it easy to customize with your own data and messaging.
Usage Points
-
Main Usage
This slide effectively visualizes project performance metrics and quality indicators across different time periods. It is particularly useful for marketing strategy presentations where period-by-period goal achievement needs to be displayed, or in project evaluation meetings where two scenarios must be compared side by side.
-
How to Use
Replace the silhouette figures on the left and right with team names or responsible parties. Update the arc chart's time periods (5-day/8-day) and quality metrics with your actual project data. Edit the title and descriptive text areas at the bottom to match your presentation context and customize the slide accordingly.
-
Recommended For
Recommended for marketing plans, business strategy presentations, project evaluation reports, performance analysis meetings, and investment proposals. Ideal for marketing managers, project managers, executives, and consultants who need to present period-by-period performance comparisons.
-
Slide Structure
The 2-slide set features a title area at the top (1 line), a central arc chart area with green and red tones (editable for periods and metrics), silhouette figure areas on both sides (text-editable), and a descriptive text area at the bottom (3-4 lines). The clear information hierarchy allows complex comparison data to be presented with excellent readability.
Related Products
-

Mobile Service Revenue Model Diagram – Integrated Business Strategy and Marketing
#Business Introduction #Marketing Plan and Strategy #Diagram
-

Traditional Korean Goods Presentation – Marketing Strategy Diagram
#Marketing Plan and Strategy #Diagram #Other
-

Blue Pink Global Network Map – Visualizing Business Strategies
#Company Introduction #Marketing Plan and Strategy #Other
-

Male and Female Analysis by Country – Insights on Gender Ratio and Market Trends
#Market and Competitor Analysis #Marketing Plan and Strategy #Diagram
