Color Area Table Schedule Chart – Effective Visualization for Operations Planning
RJ0500009_8
- Last Update 06/09/2025
- File Size 0.3MB
- # of Slides 2
- File Format PPTX
- Slide Ratio 16:9
- Color
Keywords
- #Content-Based Slides
- #Design-Based Slides
- #Operational Plan
- #Diagram
- #Capital Investment Plan
- #Project Implementation Schedule
- #Table
- #16:9
- #schedule chart PowerPoint slide
- #color-coded timeline table
- #project schedule slide
- #how to create a schedule chart in PowerPoint
- #operational planning timeline template
About the Product
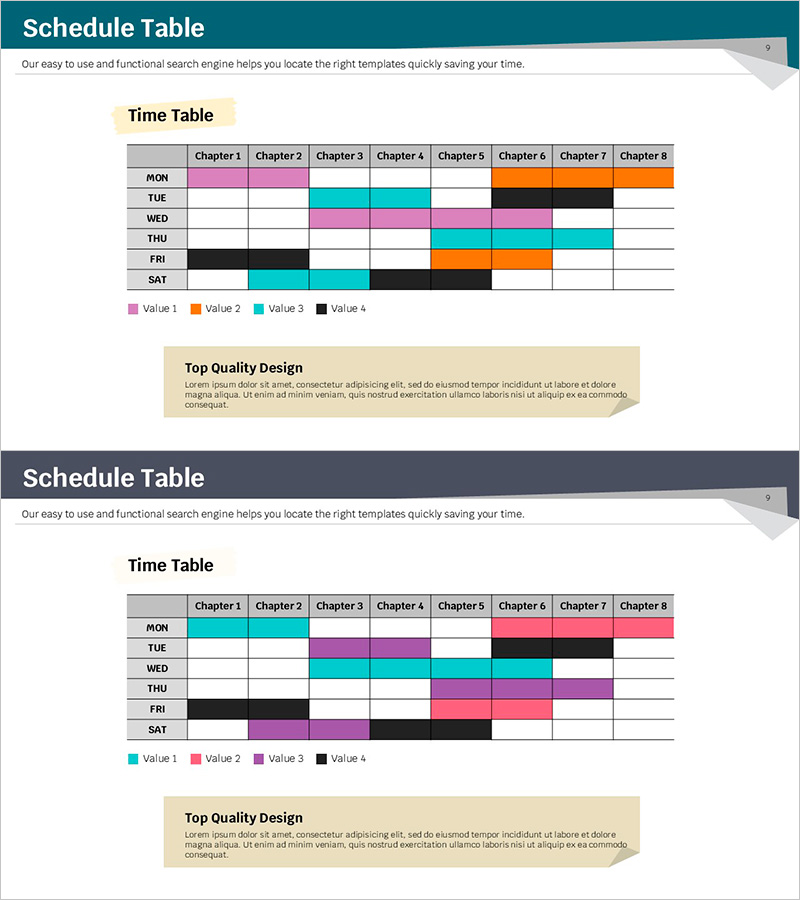
A schedule chart PowerPoint slide that uses color coding to display daily progress across 8 chapters from Monday to Saturday. This timeline table helps visualize project schedules, operational plans, and training calendars with four distinct colors—pink, orange, cyan, and black—to differentiate each task or category. The 2-slide set includes a header design and description area, making it ready to edit and use immediately for presentations, reports, and planning documents.
Usage Points
-
Main Usage
Communicate project timelines, operational schedules, and training calendars to team members and stakeholders by displaying daily progress in a clear, visual format. Color differentiation enables quick identification of priorities and task categories, accelerating decision-making.
-
How to Use
Enter task names in each cell and select corresponding colors to mark the schedule. Insert this slide into presentations, reports, and business plans to effectively explain operational timelines and project phases in meetings and stakeholder reviews.
-
Recommended For
Project managers, operations teams, training coordinators, and marketing planners who need to manage and communicate schedules. Ideal for business plans, operational plans, training program proposals, marketing campaign timelines, and project status reports.
-
Slide Structure
Header area at the top for title input, with a 6-row (Mon–Sat) × 8-column (Chapter 1–8) table below. A legend displays the four color values, and a description box at the bottom allows for additional information or notes.
Related Products
-

August, September, October Calendar Diagram – Essential for Business Strategy
#Business Strategy #Operational Plan #Diagram
-

Business Promotion Schedule and Plan Cell Phone Mockup
#Business Management #Operational Plan #Diagram
-

Surgical Gown Theme Plan Schedule – Business Management & Operations Planning
#Business Management #Operational Plan #Diagram
-

Business Promotion Schedule Roadmap – Effective Operational Plan
#Business Strategy #Operational Plan #Diagram
