Camera Usage App Analysis – Innovation and Insight
RJ0400054_7
- Last Update 06/01/2025
- File Size 0.3MB
- # of Slides 2
- File Format PPTX
- Slide Ratio 16:9
- Color
Keywords
- #Content-Based Slides
- #Design-Based Slides
- #Product/Service Introduction
- #Diagram
- #Graph
- #Other
- #Product/Service Introduction
- #Composition
- #Cluster
- #Chain Diagram
- #16:9
- #radial diagram PowerPoint
- #3-node analysis slide
- #camera app analysis presentation
- #product feature diagram
- #data visualization PPT slide
About the Product
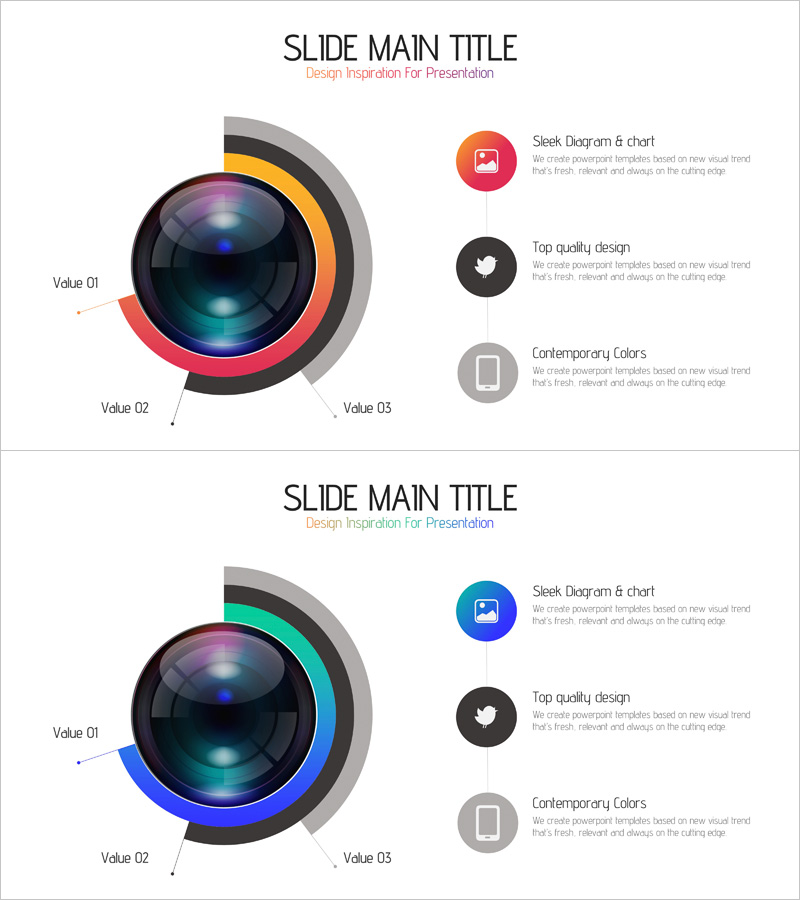
A radial diagram PowerPoint slide that analyzes key features of a camera usage app across three nodes positioned around a central lens image. The design places three items (Sleek Diagram & chart, Top quality design, Contemporary Colors) at left, right, and bottom positions, each paired with a circular icon in orange, red, blue, and gray tones. This 16:9 two-slide set features editable PPTX elements suitable for product presentations, technical analysis, and data visualization. The radial layout with color-coded icons and descriptive text creates visual hierarchy, making it ideal for app showcases, technology briefings, and marketing pitches. All slides and components are fully customizable for immediate use in presentations and slide decks.
Usage Points
-
Main Usage
Presents three core features, benefits, or characteristics of a product, app, or service arranged around a central focal point. The radial structure balances information distribution and draws attention to the central image while highlighting supporting details in surrounding nodes. Ideal for technology launches, product pitches, and competitive analysis presentations.
-
How to Use
Replace the central camera lens image with your product or service image. Edit the three node labels and descriptions to reflect your specific features or benefits. Customize the circular icon colors (orange, red, blue, gray) to match your brand palette. The two-slide variation provides color tone options: first slide emphasizes warm tones (orange, red), second slide features cool tones (blue, gray). All text and graphic elements are fully editable in PPTX format.
-
Recommended For
Product managers, marketing professionals, technology leaders, startup founders, and app development teams presenting product capabilities and competitive advantages. Particularly suited for camera, photography, video, and mobile app presentations; technology analysis reports; investor pitch decks; and product introduction presentations.
-
Slide Structure
Central 3D camera lens image with gradient lighting on dark background, surrounded by three circular icons (orange, red, blue, gray) positioned at left, right, and bottom. Each node contains icon + title + descriptive text in three-tier hierarchy. 16:9 widescreen format with symmetrical left-right layout ensures visual balance and professional appearance.
Related Products
-

Diagram Showcasing Mobile App Service Configuration
#Product/Service Introduction #Diagram #Other
-

Project Book Mockup - Optimized Design for Practical Use
#Product/Service Introduction #Other #Product/Service Introduction
-

T-shirt Goods Mockup – Product Introduction and Design
#Product/Service Introduction #Other #Product/Service Introduction
-

Sofa and Tablet Mockups for Product Visualization – Modern Sense and Style
#Product/Service Introduction #Other #Product/Service Introduction
