Insight Generation Slide Using Data Analysis Tools
RJ0400053_31
- Last Update 06/01/2025
- File Size 0.7MB
- # of Slides 2
- File Format PPTX
- Slide Ratio 16:9
- Color
Keywords
About the Product
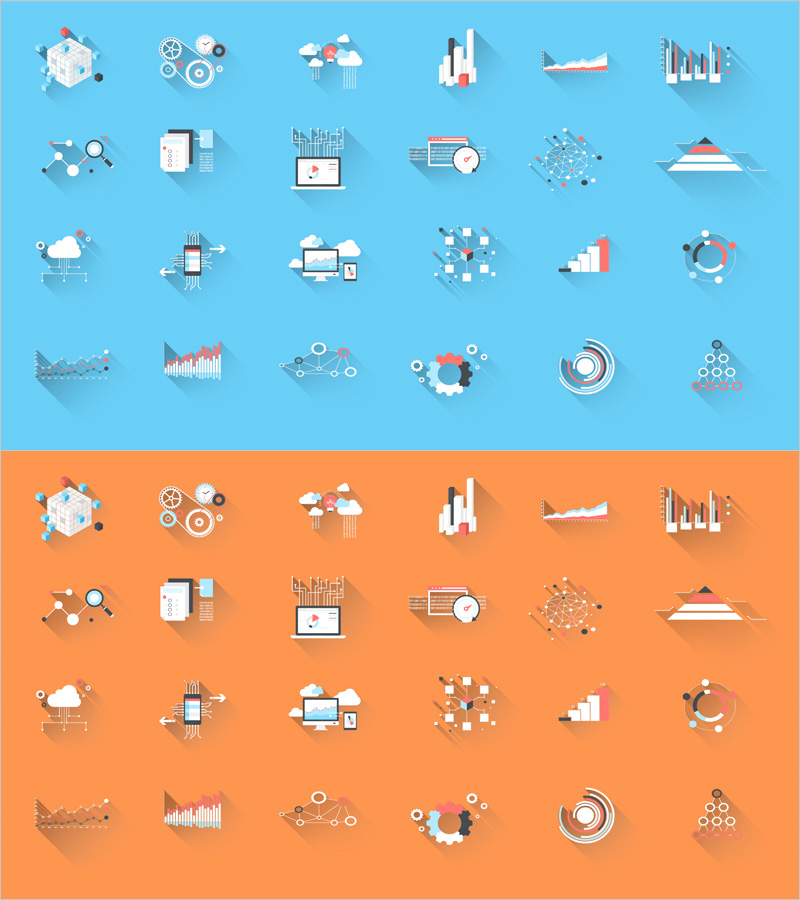
A comprehensive collection of 24 high-quality icon slides for visualizing data analysis and business insights in PowerPoint presentations. This slide deck includes diverse tool icons such as charts, graphs, analysis symbols, network diagrams, cloud computing, and machine learning representations. Designed with bright blue and orange backgrounds accented with white and red elements, it is optimized for data-driven presentations, business reports, and analytical materials. Provided in 2-slide 16:9 PPTX format with fully editable icons that can be independently resized, recolored, and repositioned. Perfect for corporate presentations, marketing materials, technical documentation, and analysis reports where visual communication of data concepts is essential.
Usage Points
-
Main Usage
Provides a visual icon library for representing data analysis, business insights, and technology solutions. With 24 diverse tool icons including charts, graphs, networks, cloud services, machine learning, and analysis symbols, it enables intuitive communication of complex data concepts to audiences.
-
How to Use
Open the slide deck in PowerPoint and select the icons needed for your presentation. Each icon is independently editable—resize, recolor, and reposition to match your corporate brand guidelines. Insert icons into data analysis sections, technology introductions, and business strategy slides to enhance visual impact and audience engagement.
-
Recommended For
Ideal for data analysts, business consultants, IT professionals, marketing managers, and executives preparing reports. Effective in business plans, technical proposals, analytical reports, marketing strategy documents, and investor pitch decks where data-driven insights need visual emphasis.
-
Slide Structure
Organized into 2 slides with 12 icons per slide, totaling 24 icons. One slide features a blue background while the other uses an orange background, providing design flexibility. All icons maintain consistent styling with white line work and red accent elements for visual cohesion.


