Global Target Market Bar Graph – Stylish and Visually Appealing
RJ0400052_7
- Last Update 05/31/2025
- File Size 7.1MB
- # of Slides 2
- File Format PPTX
- Slide Ratio 16:9
- Color
Keywords
- #Content-Based Slides
- #Design-Based Slides
- #Company Introduction
- #Market and Competitor Analysis
- #Graph
- #Other
- #Global Network
- #Target Market
- #Column
- #Segmented Column
- #Map
- #16:9
- #world map PowerPoint slide
- #global market analysis presentation
- #vertical bar chart PPT
- #geographic data visualization
- #country comparison slide template
- #international business PowerPoint
About the Product
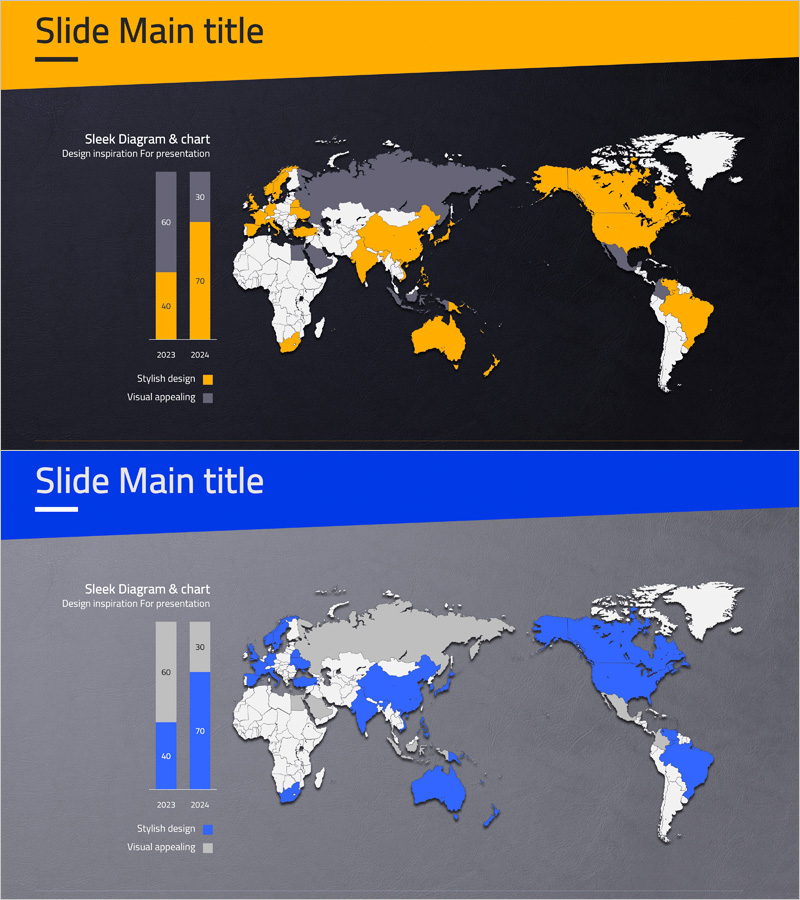
A professional world map and bar chart combination PowerPoint slide designed for global market analysis presentations. Features a dark background with gold and blue accent colors, displaying country-level market data through vertical bar graphs (2023 vs. 2024 comparison) and highlighted regions on the world map. The 16:9 format 2-slide set enables quick visualization of regional performance and market penetration. Ideal for international business pitches, market entry strategies, global expansion reports, and cross-border performance analysis presentations.
Usage Points
-
Main Usage
Visualize global market expansion, regional sales performance, and international business metrics. The world map highlights target markets by color coding, while dual bar graphs display year-over-year numerical comparisons, enabling stakeholders to grasp geographic distribution and growth trends simultaneously.
-
How to Use
Slide 1 emphasizes the world map layout for global network overview and market positioning. Slide 2 focuses on bar graph comparison for detailed numerical analysis. Both slides feature clearly defined text and data input areas, allowing seamless replacement with your own figures and labels.
-
Recommended For
International marketing managers, global business strategy teams, market research analysts, investment pitch presenters, multinational corporation executives, and cross-border sales directors preparing data-driven presentations.
-
Slide Structure
Slide 1: World map (white, gold, and blue country differentiation) + legend + title area / Slide 2: Two vertical bar graphs (2023 and 2024 year-over-year) + legend (stylish design, visual appeal) + title area. Total 2 slides, 16:9 aspect ratio, PPTX format.
Related Products
-

Dawn City Theme Global Map
#Company Introduction #Market and Competitor Analysis #Other
-

Global Target Country Map – Essential Tool for Market Analysis
#Company Introduction #Market and Competitor Analysis #Other
-

Black Blue Global Map for Global Network
#Company Introduction #Market and Competitor Analysis #Other
-

Target Market Global Network Map – Visualizing Business Strategy
#Company Introduction #Market and Competitor Analysis #Other
