World Map of Smoking Areas by Country - Global Network Visualization
RJ0400037_17
- Last Update 05/27/2025
- File Size 6.1MB
- # of Slides 2
- File Format PPTX
- Slide Ratio 16:9
- Color
Keywords
About the Product
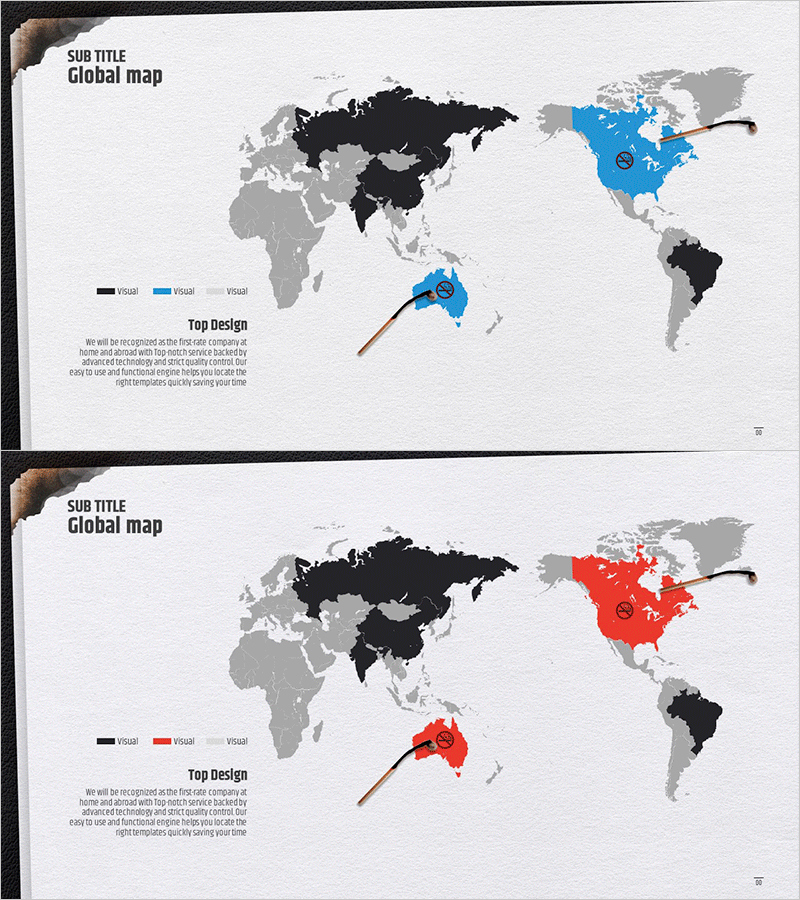
A global network world map PowerPoint slide for visualizing country-specific data with clear regional distinction. This presentation template uses three color schemes—black, blue, and red—to highlight different geographic areas, making international comparative analysis intuitive and visually compelling. Ideal for company introduction presentations, investor pitches, and partnership discussions where you need to showcase global business scope, regional strategies, and international networks. The 2-slide set offers flexible data emphasis approaches, optimized for 16:9 widescreen format in modern presentation environments. Text description areas and map visualization are balanced to convey credibility to investors and partners.
Usage Points
-
Main Usage
Visualize international business scope, regional strategies, and global partnerships at a glance. Three distinct color highlights—black, blue, and red—clearly differentiate regions, conveying your company's global network scale and strategic positioning with credibility to investors and partners.
-
How to Use
Use in the global network or business scope section of company introduction presentations. The 2-slide format allows you to emphasize different regions on each slide—blue highlight on the first, red on the second—enabling comparative regional data visualization. Add region-specific business status, revenue distribution, and strategic importance in the text areas for customized presentations.
-
Recommended For
Recommended for multinational company introductions, investment pitches, and international partnership presentations. Particularly effective for executive presentations emphasizing global business reach, investor meetings with overseas stakeholders, and international conference presentations. Strengthens credibility when explaining regional market entry, global supply chains, and international collaboration structures.
-
Slide Structure
2-slide layout with each slide divided into map visualization area (approximately 70%) and text description area (approximately 30%). Pointer markers on the map highlight specific regions, with a legend (black, blue, red) clarifying regional classification. The text area provides dedicated spaces for title, subtitle, and descriptive content, allowing flexible data input and customization.
Related Products
-

Global Target Market Analysis Map – Effective Overseas Expansion Strategy
#Company Introduction #Market and Competitor Analysis #Other
-

Global Target Market Goal Map
#Company Introduction #Marketing Plan and Strategy #Other
-

World Map Infographic for Global Network Presentation
#Company Introduction #Other #Global Network
-

Global Network Analysis – Essential Slide for Company Overview
#Company Introduction #Other #Global Network
