Map of Sugar Use by Country
RJ0400034_19
- Last Update 05/26/2025
- File Size 2.4MB
- # of Slides 2
- File Format PPTX
- Slide Ratio 16:9
- Color
Keywords
About the Product
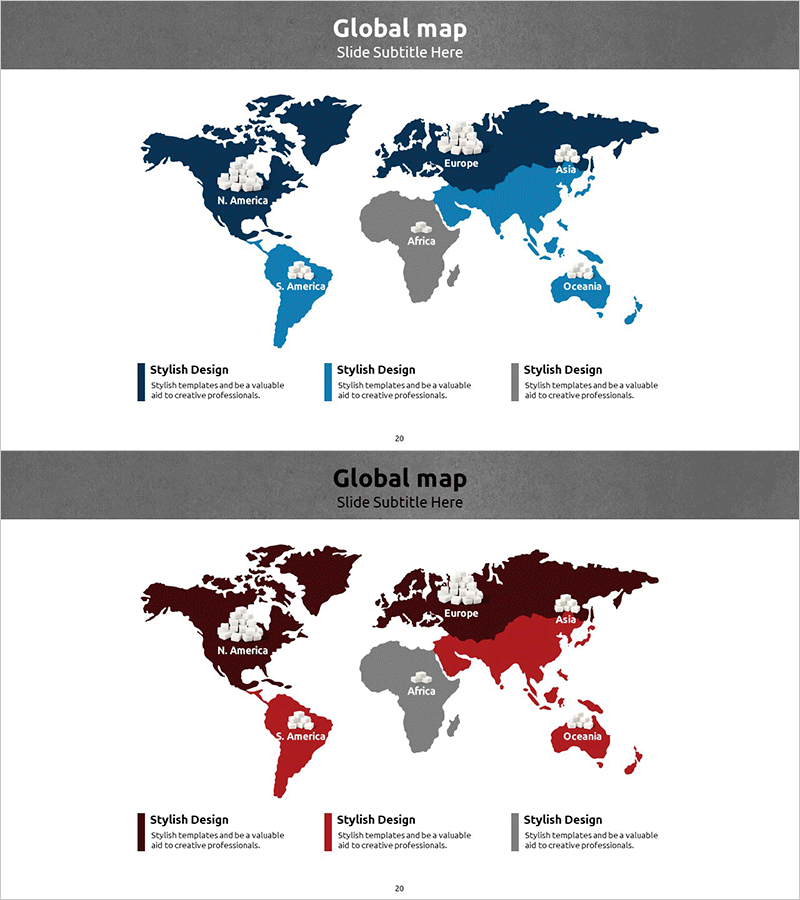
This slide presents a visually engaging map analyzing sugar consumption across countries. It is designed for easy understanding of sugar usage patterns, making it useful for global market entry strategies and competitive analysis. The blue, red, and gray color scheme effectively distinguishes data regarding each nation. This map slide is ideal for market research reports or global business presentations, offering intuitive information. Text and mapping data are easy to replace with an overall editing difficulty rated as 'easy'.
Usage Points
-
Main Usage
- This template serves as a comprehensive tool for analyzing sugar consumption trends across different countries, making it essential for professionals involved in international market assessments and strategy development.
-
How to Use
- Users can integrate this template into market research presentations or strategy meetings, where visual data representation is crucial for conveying complex information to stakeholders effectively.
-
Recommended For
- This template is particularly beneficial for market analysts, business strategists, and researchers who need to present data-driven insights in a clear and engaging manner during industry conferences or corporate strategy sessions.
-
Slide Structure
- The presentation is organized into several sections, each focusing on a specific aspect of sugar consumption data, allowing for a logical flow of information that facilitates easy comparisons and insights during discussions.
Related Products
-

Target Country Analysis Map – Insights into Global Markets
#Company Introduction #Market and Competitor Analysis #Graph
-

Black Blue Global Map for Global Network
#Company Introduction #Market and Competitor Analysis #Other
-

Target Market Goal Map for Global Market Analysis
#Company Introduction #Market and Competitor Analysis #Other
-

Target Country Revenue Analysis - Including South Korea
#Company Introduction #Market and Competitor Analysis #Other
