U.S. Target Market Analysis Slide – Understanding and Analysis
RJ0400032_13
- Last Update 05/26/2025
- File Size 8.4MB
- # of Slides 2
- File Format PPTX
- Slide Ratio 16:9
- Color
Keywords
About the Product
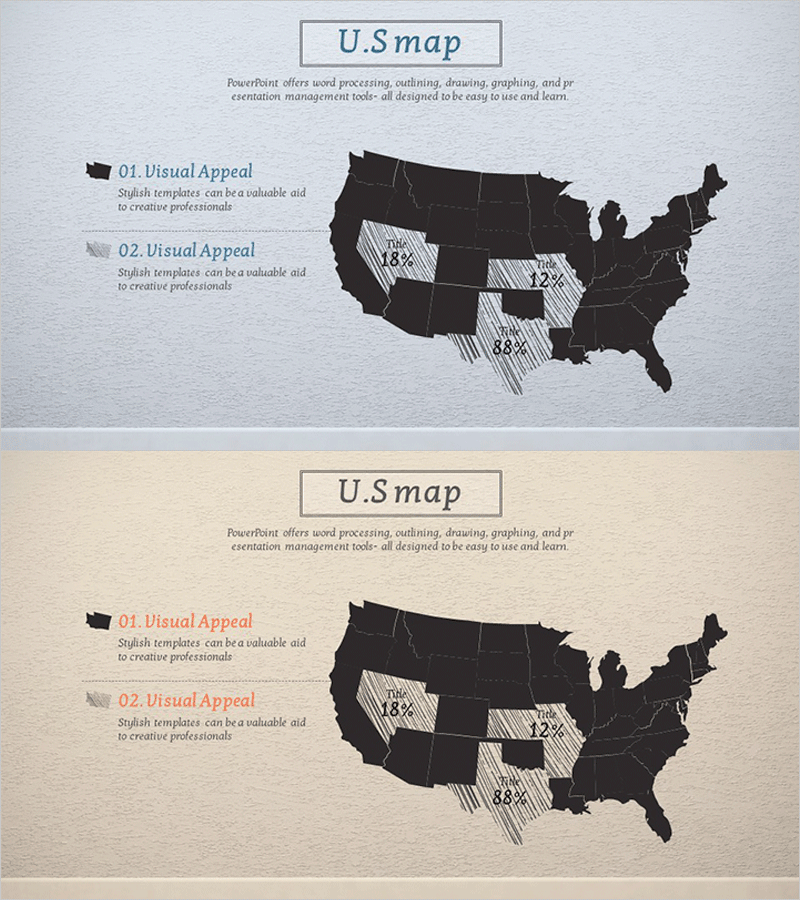
A 2-slide PowerPoint presentation set designed for U.S. target market analysis using geographic visualization. The slides feature a black background with white hatching to highlight specific U.S. states, enabling intuitive regional market representation. The first slide presents the complete U.S. map with three emphasized regions, while the second slide uses the same map with additional text areas for detailed analysis. Ideal for competitive analysis, market share discussions, and regional strategy presentations. Optimized for 16:9 widescreen format and fully editable in PPTX format for seamless customization of state names, data points, and annotations.
Usage Points
-
Main Usage
This slide set is optimized for visualizing U.S. market analysis by geographic region and regional strategy development. The black background map with white-hatched state emphasis allows stakeholders to quickly identify market concentration, regional opportunities, and competitive positioning across different U.S. territories.
-
How to Use
Use the first slide to introduce the overall U.S. market overview and geographic scope. Deploy the second slide when presenting detailed regional data, market insights, or strategic recommendations. Edit the highlighted state names and numerical data to match your specific market analysis focus.
-
Recommended For
Market analysts, sales strategy teams, investor relations professionals, and marketing strategists presenting U.S. market entry strategies, regional sales forecasts, and competitive landscape analysis. Suitable for B2B proposals, business plans, and market research report sections.
-
Slide Structure
Two-slide layout with the first slide containing a title area and single U.S. map element. The second slide maintains the same map with two additional text explanation areas on the left side, enabling combined data visualization and interpretive commentary.
Related Products
-

Effective Slide Template for Global Financial Services
#Company Introduction #Market and Competitor Analysis #Other
-

Global Target Market Analysis Slide – Strategic Insights
#Company Introduction #Market and Competitor Analysis #Other
-

Global Market Target Countries Infographic Slide
#Company Introduction #Market and Competitor Analysis #Other
-

Slide Showing Target Market and Numbers
#Market and Competitor Analysis #Marketing Plan and Strategy #Other
