
Visually Appealing Free Green Graph Template
O0100135
- Last Update 10/31/2025
- File Size 8.1MB
- # of Slides 5
- File Format PPTX
- Slide Ratio 16:9
- Color
Slide Preview


Keywords
About the Product
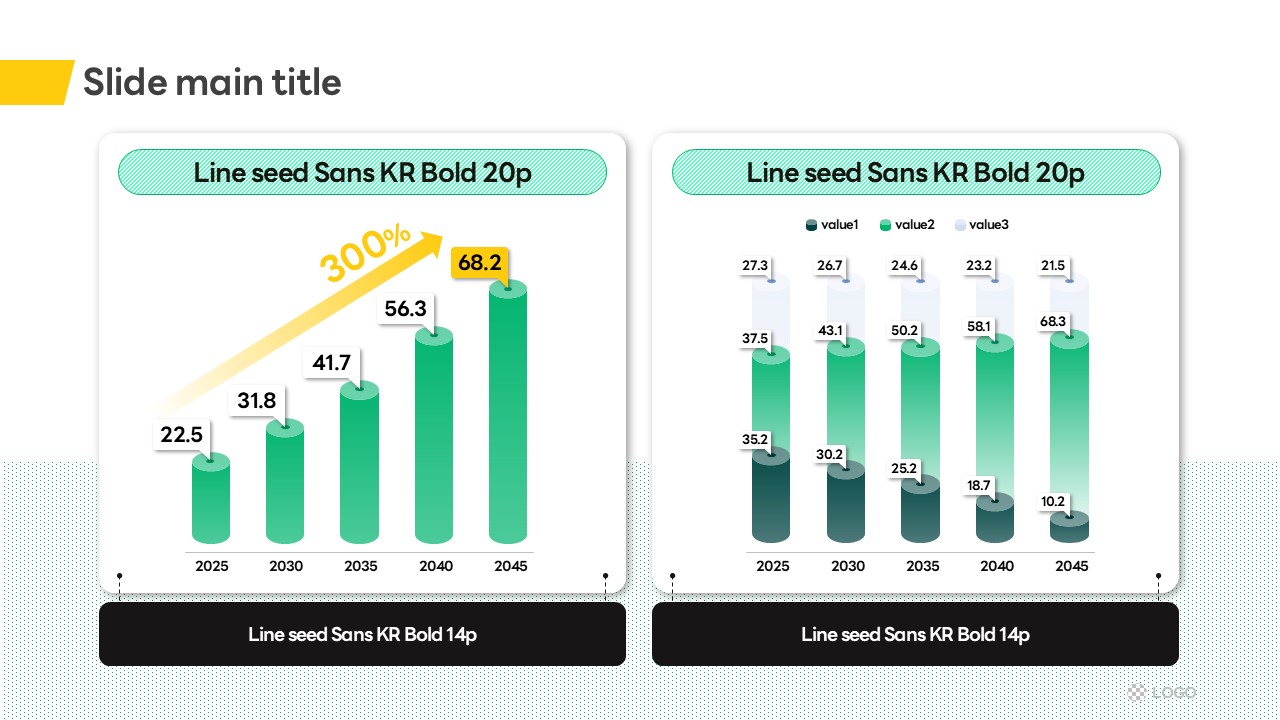
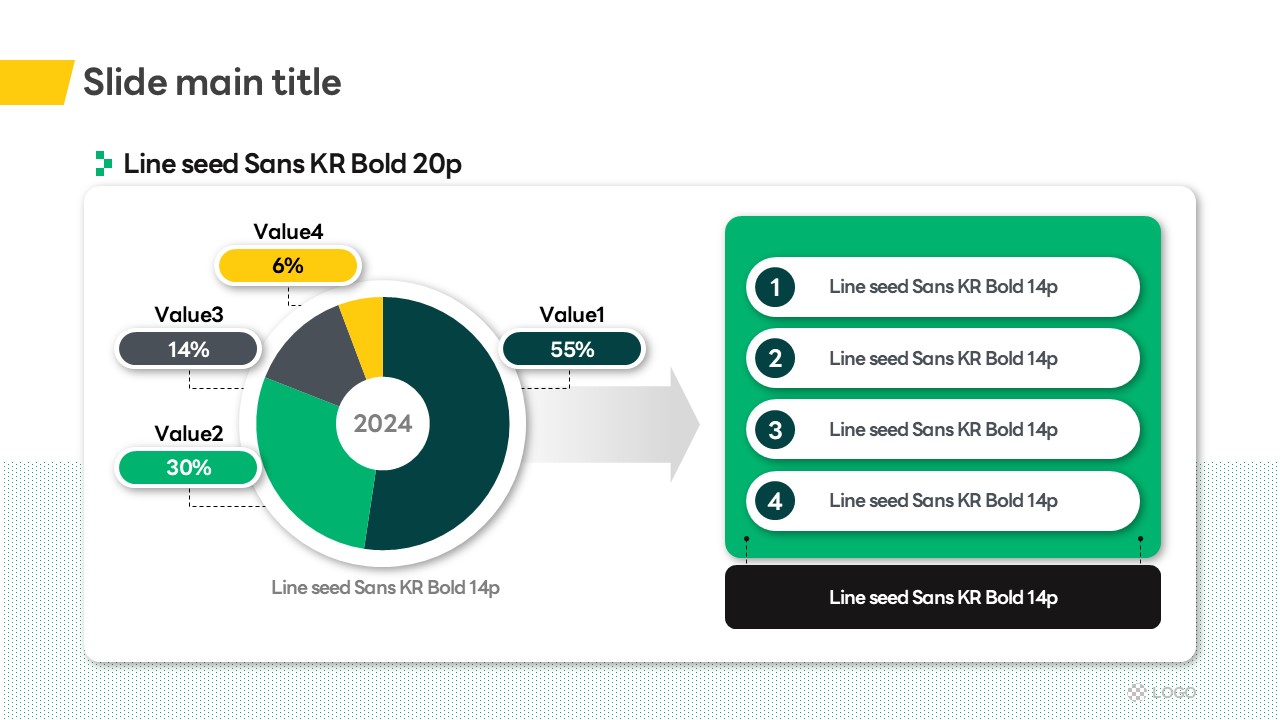
This free PowerPoint template features a white background with emerald and mint green 3D isometric graph objects, delivering a polished and professional look for data-driven presentations. The 5-slide set includes a bar chart comparison slide, a donut chart slide, a contents slide, and a closing slide, making it easy to build a complete presentation deck from scratch. A two-column grid layout with yellow title accent badges ensures clear information hierarchy and strong visual impact. The PPTX file is fully editable in PowerPoint—simply replace the numbers, text, and colors to match your data. Suitable for sales reports, market analysis, business performance reviews, and a wide range of corporate presentations. For more advanced graph and chart designs, explore GoodPello's premium template collection.
Usage Points
-
Main Usage
Designed to visualize numerical data such as sales trends, market share, and performance KPIs in a clear and impactful way for business presentations and reports.
-
How to Use
Download the PPTX file and open it in PowerPoint. Replace the chart values, text labels, and color accents with your own data. Use the bar chart and donut chart slides selectively based on the type of data you need to present.
-
Recommended For
Ideal for business professionals, startup teams, marketers, and analysts who need a ready-to-use, data-focused free slide set for reports, pitches, or performance reviews.
-
Slide Structure
5 slides total: 3D graph object cover slide → 5-item contents slide → two bar chart comparison slides → donut chart with list slide → Thank you closing slide.


