Medical Business Goals Connection Diagram
RJ0400018_27
- Last Update 05/22/2025
- File Size 0.5MB
- # of Slides 2
- File Format PPTX
- Slide Ratio 16:9
- Color
Keywords
About the Product
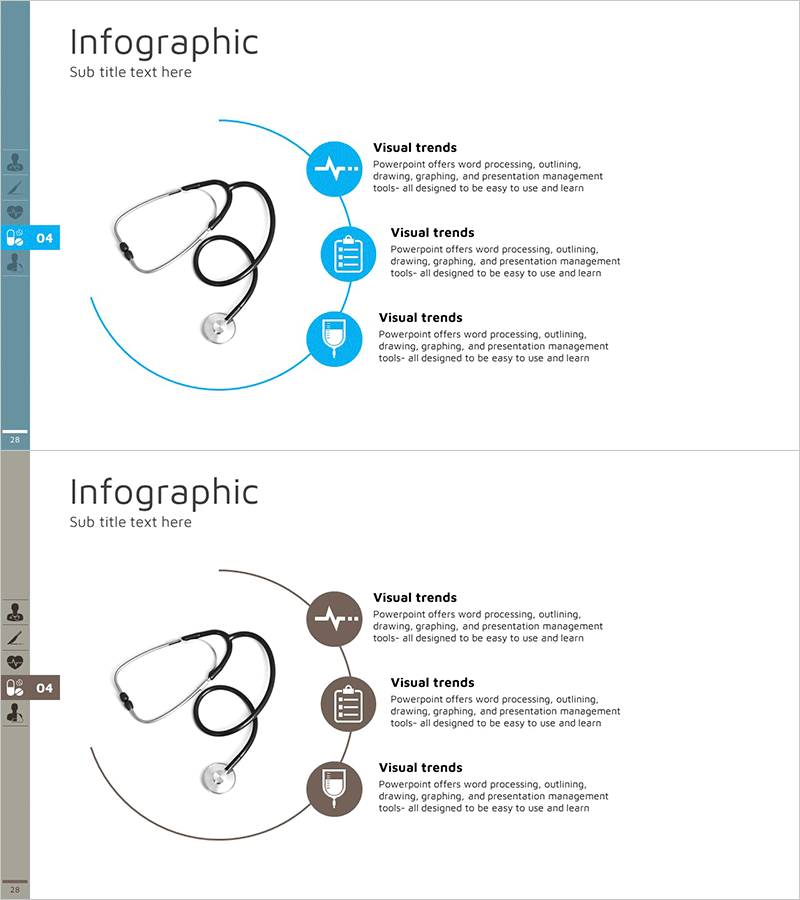
A 3-node cluster diagram PowerPoint slide that visually connects medical institution business objectives. Featuring blue circular nodes and curved connecting lines, this slide clearly expresses the interrelationships between business vision, strategy, and execution goals. The minimalist blue-toned layout emphasizes healthcare credibility and professionalism, making it immediately applicable to hospital executive presentations, business strategy meetings, and investor briefings. The 2-slide set provides color variations in blue and gray tones to maintain consistency across presentation materials.
Usage Points
-
Main Usage
Visualizes medical institution business vision, strategy, and execution goals as interconnected relationships to communicate integrated business direction to executives and stakeholders. Effectively emphasizes core messages in hospital management strategy, business planning, and organizational goal-sharing contexts.
-
How to Use
Insert this slide in the business strategy section of presentations to introduce key medical institution objectives. Enter specific goal names in each node (e.g., patient satisfaction improvement, medical technology innovation, community contribution) and explain mutual influence relationships through curved connecting lines. Adapt to various presentation contexts using color variations.
-
Recommended For
Hospital executives, medical institution planning teams, healthcare consultants, and healthcare marketing professionals presenting business strategies, investor briefings, organizational restructuring meetings, and mid-term management plans. Ideal for all presentation scenarios requiring healthcare industry credibility and professionalism.
-
Slide Structure
2-slide set with blue background and gray background versions. Each slide features a stethoscope silhouette image on the left-center, with 3 circular nodes (top, middle, bottom) on the right connected by curved lines. Each node includes an icon and text input area for customized content creation.
Related Products
-

Triple Connected Learning Diagram – Business Vision and Goals
#Business Vision and Strategy #Diagram #Business Vision
-

VR Business Vision Diagram for Visualizing Business Objectives
#Business Vision and Strategy #Diagram #Business Vision
-

Space Industry Triangle Diagram – Business Vision and Goals
#Business Vision and Strategy #Diagram #Business Vision
-

Renewable Energy Business Differentiation Strategy Connection Diagram
#Business Vision and Strategy #Diagram #Business Vision
