Table of Contents Featuring Data Flow Graphics
RJ0300101_2
- Last Update 05/17/2025
- File Size 14.3MB
- # of Slides 2
- File Format PPTX
- Slide Ratio 16:9
- Color
Keywords
About the Product
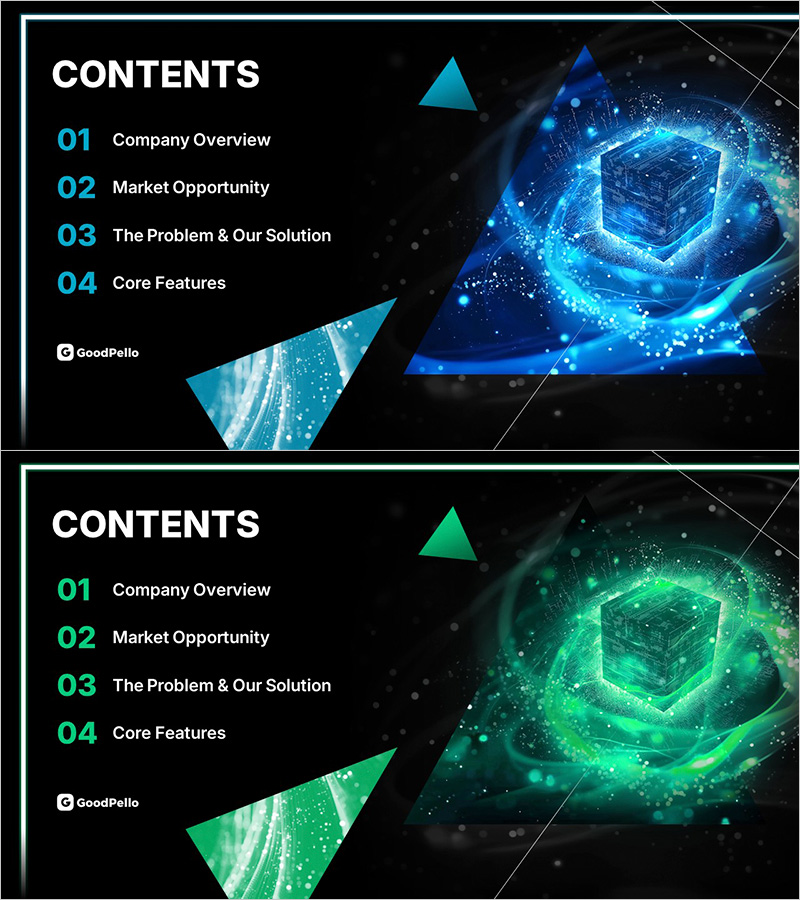
A professional table of contents PowerPoint slide optimized for technology company presentations. Set against a black background, it features blue and green 3D cube graphics with data flow elements that convey a modern, cutting-edge aesthetic. Four main sections (Company Overview, Market Opportunity, The Problem & Our Solution, Core Features) are clearly organized with numbered labels and geometric triangle accents enhanced by particle effects for visual depth. The 2-slide set offers color variations (blue and green) to match your brand identity. Delivered in 16:9 widescreen PPTX format, fully editable and ready to use immediately.
Usage Points
-
Main Usage
This slide serves as a visual table of contents for technology, IT, and innovation-focused presentations, including investor pitches, product launches, and technical seminars. It clearly presents four key sections with numbered labels, helping audiences understand the presentation flow and structure at a glance. The 3D cube and data flow graphics reinforce technical credibility and forward-thinking positioning.
-
How to Use
Use this slide at the beginning of your presentation to outline the agenda and guide audience expectations. Highlight the corresponding section number as you progress through each topic, allowing viewers to track their position in the presentation. Choose the blue version for tech/IT companies or the green version for sustainability/healthcare sectors. Customize the section titles by editing the text fields to match your specific presentation topics.
-
Recommended For
Ideal for IT, software, cloud computing, and SaaS company presentations, technology conferences, product launch decks, startup pitch presentations, and technical solution proposals. Particularly effective when presenting to investors, partners, or enterprise clients where demonstrating innovation and professional expertise is critical.
-
Slide Structure
The slide employs a two-column layout: left side contains the title and four numbered sections (01–04) with descriptive text, while the right side features the 3D cube, data flow graphics, and particle effects. Each section is hierarchically organized with numbers and labels, reinforced by geometric elements. The 2-slide set provides color variations for flexible brand alignment.
Related Products
-

Photography Proposal Template Contents – Professionalism and Creativity
#Slide Type #Table of Contents
-

Interior Business Plan Template Contents - Modern Design
#Slide Type #Table of Contents
-

Idea Marketing Plan Template Contents – Business Insights
#Slide Type #Table of Contents
-

Startup Business Plan Template Contents – A Creative Vision Start
#Slide Type #Table of Contents
