Goal Setting and Analysis Bar Graph
RJ0300072_6
- Last Update 05/08/2025
- File Size 0.2MB
- # of Slides 2
- File Format PPTX
- Slide Ratio 16:9
- Color
Keywords
- #Content-Based Slides
- #Design-Based Slides
- #Business Vision and Strategy
- #Marketing Plan and Strategy
- #Graph
- #Business Goals
- #Marketing Objectives
- #Horizontal Bar
- #Horizontal Bar Chart
- #16:9
- #horizontal bar chart PowerPoint
- #goal setting presentation slide
- #data comparison chart
- #performance analysis template
- #bar graph slide design
About the Product
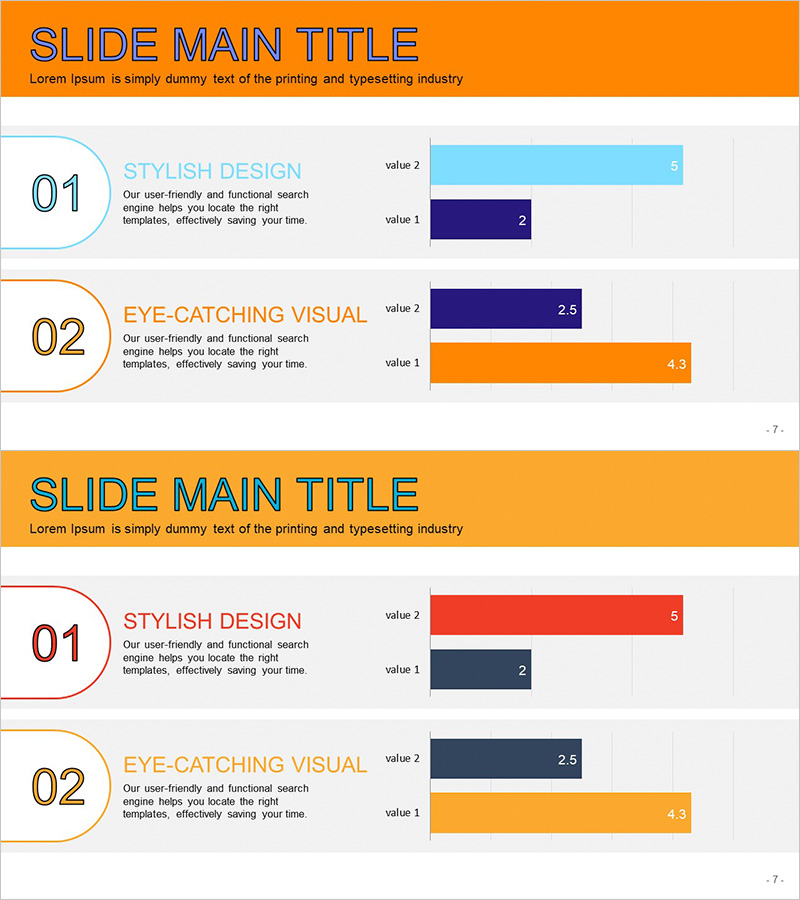
A horizontal bar chart PowerPoint slide designed to visualize goal setting and performance analysis. This presentation template uses a multi-color palette of orange, blue, and purple tones to compare numerical data across two items. Each item displays two data series (value 1 and value 2), enabling side-by-side comparison of target versus actual results or period-over-period performance. The 2-slide deck in 16:9 widescreen format is ready to use for marketing strategy, business vision, and data analysis presentations. Fully editable PPTX format allows you to customize colors, values, and labels to match your specific data and branding requirements.
Usage Points
-
Main Usage
Optimized for comparing target versus actual values or period-over-period performance across two distinct items. Displays two data series per item simultaneously, allowing complex metrics to be visualized at once. The contrasting orange, blue, and purple color scheme ensures clear data differentiation and visual impact.
-
How to Use
Use in marketing strategy presentations to compare goal KPIs against achievement rates, or in business vision updates to display performance by department or fiscal year. Ideal for data analysis reports requiring multi-metric comparison, and ready to deploy in meetings, seminars, and training materials without additional design work.
-
Recommended For
Recommended for marketing professionals, business analysts, planners, and executives presenting performance metrics and goal achievement status. Suitable for quarterly or annual performance reviews, departmental KPI comparisons, marketing campaign effectiveness measurement, and any scenario requiring clear quantitative data communication.
-
Slide Structure
2-slide deck with each slide displaying 2 items (01, 02) as horizontal bars. Each item contains 2 data series (value 1, value 2) color-coded for distinction. Layout features item names and descriptive text on the left, with bar charts on the right in a two-column arrangement. 16:9 widescreen aspect ratio optimized for large-screen presentations and modern display formats.
Related Products
-

Business Goal Step 3 Cluster Diagram – Strategy for Achieving Vision
#Business Vision and Strategy #Marketing Plan and Strategy #Diagram
-

Gradient Goal Diagram - Visualizing Business Growth Vision
#Business Vision and Strategy #Marketing Plan and Strategy #Diagram
-

Square Connection Circle Diagram – Visualizing Business Vision and Marketing Strategy
#Business Vision and Strategy #Marketing Plan and Strategy #Diagram
-

Goals by Amount Achieved – Vision and Strategy
#Business Vision and Strategy #Marketing Plan and Strategy #Diagram
